1.3 Working with probabilities
In the previous section we encountered two interpretations of probability: long run relative frequency and subjective. We will use these interpretations interchangeably. With subjective probabilities it is often helpful to consider what might happen in a simulation. It is also useful to consider long run relative frequencies in terms of relative degrees of likelihood. Fortunately, the mathematics of probability work the same way regardless of the interpretation.
1.3.1 Consistency requirements
With either the long run relative frequency or subjective probability interpretation there are some basic logical consistency requirements which probabilities need to satisfy. Roughly, probabilities cannot be negative and the sum of probabilities over all possible outcomes must be 100%. We will formalize these requirements in mathematical formulas later. For now, we just proceed using intuition.
Example 1.4 As of Jun 17, FiveThirtyEight listed the following probabilities for who will win the 2022 World Series.
| Team | Probability |
|---|---|
| Los Angeles Dodgers | 20% |
| New York Yankees | 20% |
| Houston Astros | 9% |
| San Diego Padres | 8% |
| Other |
According to FiveThirtyEight (as of June 17):
- What would you expect the results of 10000 repetitions of a simulation of the World Series champion to look like? Construct a table summarizing what you expect. Is this necessarily what would happen?
- What must be the probability that the Dodgers do not win the 2022 World Series?
- What must be the probability that one of the above four teams is the World Series champion?
- What must be the probability that a team other than the above four teams is the World Series champion? That is, what value goes in the “Other” row in the table?
Solution. to Example 1.4
Show/hide solution
While these particular probabilities are subjective, imagining probabilities as relative frequencies often helps our intuition. If we think of this as a simulation, each repetition results in a World Series champion and in the long run we would expect the Dodgers would be the champion in 20%, or 2000, of the 10000 repetitions. We would expect the simulation results to look like
Team Repetitions as winner Los Angeles Dodgers 2000 New York Yankees 2000 Houston Astros 900 San Diego Padres 800 Other 4300 Total 10000 Of course, there would be some variability from simulation to simulation, just like in the sets of 1000 coin flips in Figure Figure 1.5. But the above counts represent about what we would expect.
80%. Either the Dodgers win or they don’t; if there’s a 20% chance that the Dodgers win, there must be a 80% chance that they do not win. If we think of this as a simulation with 10000 repetitions, each repetition results in either the Dodgers winning or not, so if they win in 2000 of repetitions then they must not win in the other 8000.
57%. There is only one World Series champion, so if say the Dodgers win then no other team can win. Thinking again of the simulation, the repetitions in which the Dodgers win are distinct from those in which the Astros win. So if the Dodgers win in 2000 repetitions and the Astros win in 900 repetitions, then on a total of 2900 repetitions either the Dodgers or Astros win. Adding the four probabilities, we see that the probability that one of the four teams above wins must be 57%.
43%. Either one of the four teams above wins, or some other team wins. If one of the four teams above wins in 5700 repetitions, then in 4300 repetitions the winner is not one of these four teams.
Example 1.5 Suppose your subjective probabilities for the 2022 World Series champion satisfy the following conditions.
- The White Sox and Brewers are equally likely to win
- The Astros are 1.5 times more likely than the White Sox to win
- The Dodgers are 2 times more likely than the Astros to win
- The winner is as likely to be among these four teams — Dodgers, Astros, White Sox, Brewers — as not
Construct a table of your subjective probabilities like the one in Example 1.4.
Solution. to Example 1.5
Show/hide solution
Here, probabilities are specified indirectly via relative likelihoods. We need to find probabilities that are in the given ratios and add up to 100%. It helps to designate one outcome as the “baseline”. It doesn’t matter which one; we’ll choose the White Sox.
- Suppose the White Sox account for 1 “unit”. It doesn’t really matter what a unit is, but let’s say it corresponds to 1000 repetitions of the simulation. That is, the White Sox win in 1000 repetitions. Careful: we haven’t yet specified how many total repetitions we have done, or how many units the entire simulation accounts for. We’re just starting with a baseline of what happens for the White Sox.
- The White Sox and Brewers are equally like to win, so the Brewers also account for 1 unit.
- The Astros are 1.5 times more likely than the White Sox to win, so the Astros account for 1.5 units. If 1 unit is 1000 repetitions, then the Astros win in 1500 repetitions, 1.5 times more often than the White Sox.
- The Dodgers are 2 times more likely than the Astros to win, so the Dodgers account for \(2\times 1.5=3\) units. If 1 unit is 1000 repetitions, then the Dodgers win in 3000 repetitions.
- The four teams account for a total of \(1+1+1.5+3 = 6.5\) units. Since the winner is as likely to among these four teams as not, then “Other” also accounts for 6.5 units.
- In total, there are 13 units which account for 100% of the probability. The White Sox account for 1 unit, so their probability of winning is \(1/13\) or about 7.7%. Likewise, the probability that the Dodgers win is \(3/13\) or about 23.1%.
| Team | Units | Repetitions | Probability |
|---|---|---|---|
| Los Angeles Dodgers | 3.0 | 3000 | 23.1% |
| Houston Astros | 1.5 | 1500 | 11.5% |
| Chicago White Sox | 1.0 | 1000 | 7.7% |
| Milwaukee Brewers | 1.0 | 1000 | 7.7% |
| Other | 6.5 | 6500 | 50.0% |
| Total | 13.0 | 13000 | 100.0% |
You should verify that all of the probabilities are in the specified ratios. For example, the Dodgers are 2 times more likely (\(2 = 23.1 / 11.5\)) than the Astros to win, and the Astros are 1.5 times more likely \((1.5 \approx 11.5 / 7.7)\) than the White Sox to win.
We could have also solved this problem using algebra. Let \(x\) be the probability, as a decimal, that the White Sox are the winner. (Again, it doesn’t matter which team is the baseline.) Then \(x\) is also the probability that the Brewers are the winner, \(1.5x\) for the Astros, and \(3x\) for the Dodgers. The probability that one of the four teams wins is \(x + x + 1.5x + 3x = 6.5x\), so the probability of Other is also \(6.5x\). The probabilities in decimal form must sum to 1 (that is, 100%), so \(1 = x + x + 1.5x + 3x + 6.5x = 13x\). Solve for \(x=1/13\) and then plug in \(x=1/13\) to find the other probabilities.
Example 1.5 illustrates one way of formulating probabilities. We start by specifying probabilities in relative terms, and then “normalize” these probabilities so that they add up to 100% while maintaining the ratios. As in the example, it helps to consider one outcome as a “baseline” and to specify all likelihoods relative to the baseline.
Figure Figure 1.7 provides a visual representation of Example 1.5. The ratios provided in the problem setup are enough to draw the shape of the plot, represented by the plot on the left without a scale on the vertical axis. The heights are equal for the White Sox and the Brewers, the height for the Astros is 1.5 times higher, etc. The plot on the right simply adds a probability axis to ensure the values add to 1. The plot on the right represents the “normalization” step, but it does not affect the shape of the plot or the relative heights of the bars.
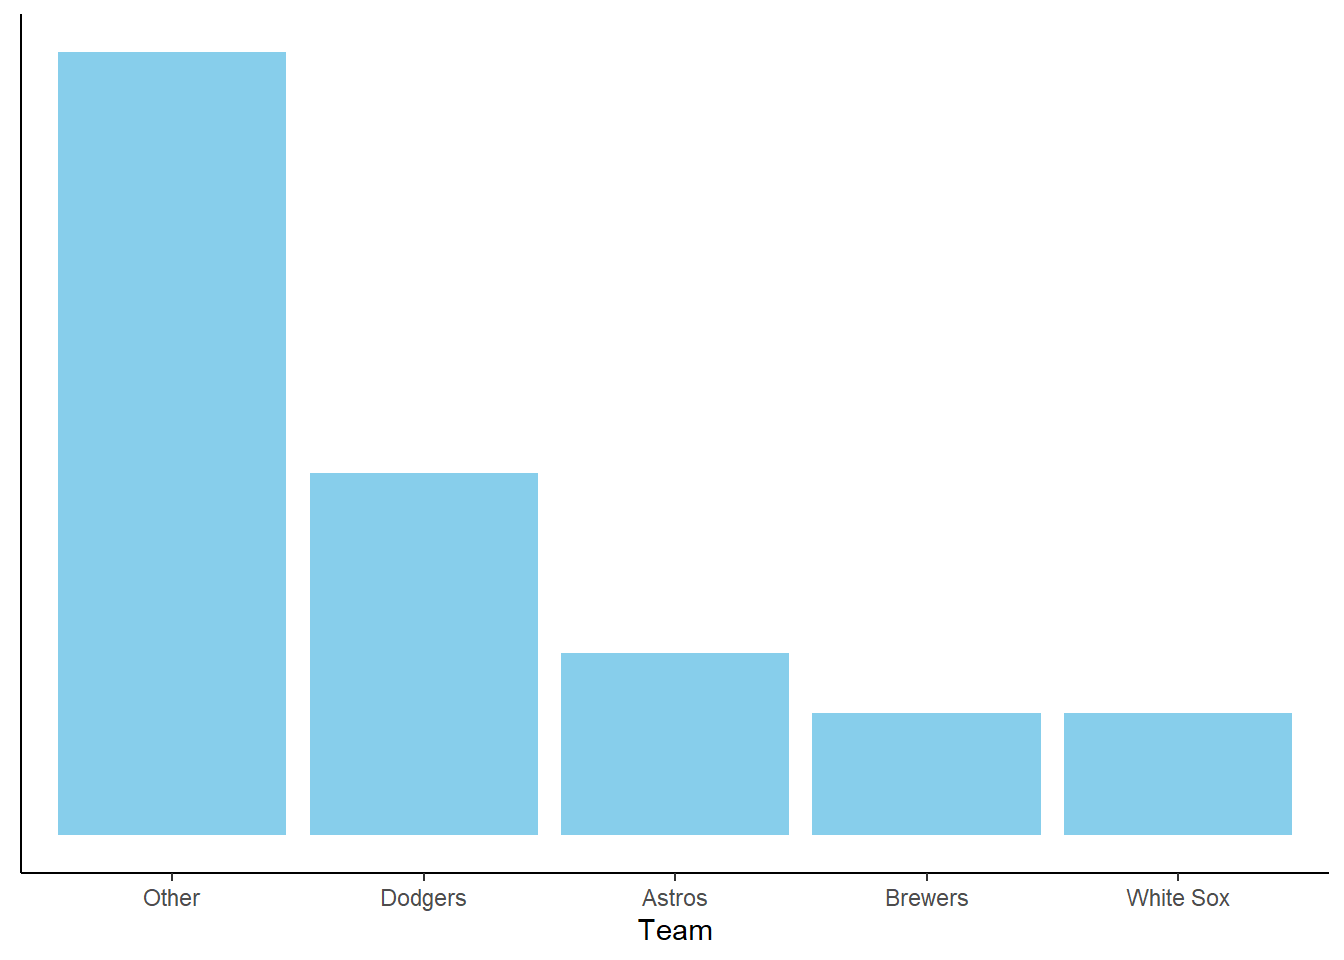
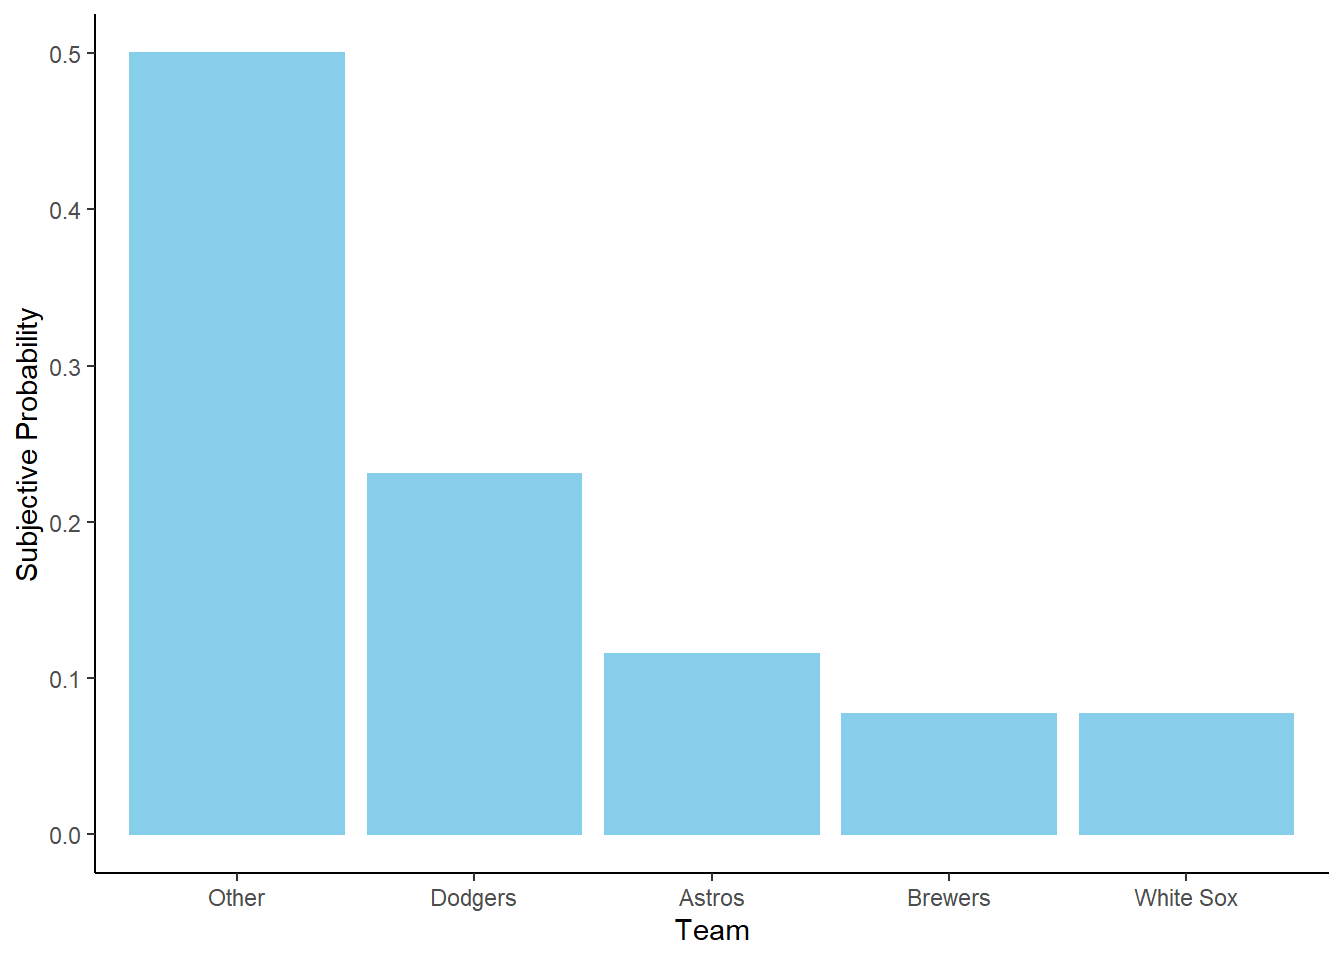
Figure 1.7: Bar chart representation of the subjective probabilities in Example 1.5. Left: Relative heights without absolute scale. Right: Heights scaled to sum to 1 to represent probabilities.
1.3.2 Odds
The words “probability”, “chance”, “likelihood”, and “odds” are colloquially treated as synonyms. However, in the mathematical language of probability, odds provide a different way of reporting a probability. Rather than reporting probability on a 0% to 100% scale, odds report probabilities in terms of ratios.
Example 1.6 In Example 1.4 the odds that the Astros win the World Series are about 10 to 1 against.
- What do you think that “10 to 1 against” means?
- What are the odds of the Astros not winning?
- What are the odds of the Dodgers winning?
- What are the odds of one of the Other teams winning?
- The Philadelphia Phillies have 50 to 1 odds against winning. What is the probability that the Phillies win the World Series?
Solution. to Example 1.6
Show/hide solution
The probability that the Astros win is 0.09, so the probability that they do not win is 0.91. These numbers are in a 10 to 1 ratio: the probability of not winning (0.91) is about 10 (\(10.1 \approx 0.91/0.09\)) times greater than the probability of winning (0.09). So the odds against the Astros winning the World Series are about 10 to 1; “against” because the Astros are less likely to win than to not win.
The probabilities are still in the 10 to 1 ratio, but we can say that the odds are 10 to 1 in favor of the Astros not winning. We could also say the odds are 1 to 10 in favor of the Astros winning, but odds are typically reported with the larger value first — 10 to 1 instead of 1 to 10.
The probability that the Dodgers win is 0.20 and that they don’t win is 0.80, and \(0.80/0.20 = 4\). So the odds are 4 to 1 against the Dodgers winning; “against” because the Dodgers are less likely to win than to not win.
The probability that an Other team wins is 0.43 and that an Other team doesn’t win is 0.57, and \(0.57/0.43 \approx 1.33\). So the odds are 1.33 to 1 against an Other team winning. Odds are often reported as whole numbers, so we could say the odds are 13 to 10 against an other team winning.
The probability that the Phillies do not win is 50 times greater than the probability that they do win. Let the event that the Phillies win account for 1 “unit” so that the event that they do not win accounts for 50 units, for a total of 51 units. So the probability that the Phillies win is \(1/51\approx 0.02\). Note that the probability of not winning, 50/51, is 50 times greater than the probability of winning.
You could also solve this with algebra. Let \(x\) be the probability that the Phillies win, so \(50x\) is the probability that they don’t win. The probabilities must sum to 1, so set \(x + 50x = 1\) and solve for \(x\).
The odds of an event is a ratio6 involving the probability that the event occurs and the probability that the event does not occur. Odds can be expressed as either “in favor” of or “against” the event occurring.
\[ \begin{aligned} \text{odds in favor} & = \frac{\text{probability that the event occurs}}{\text{probability that the event does not occur}} \\ & \\ \text{odds against} & = \frac{\text{probability that the event does not occur}}{\text{probability that the event occurs}}\end{aligned} \]
In some situations odds are typically reported as odds against. While the odds of an event is a just a single number, odds are often reported as a ratio of whole numbers, e.g., 11 to 1, 7 to 2.
As discussed at the end of Section 1.2.2 bets can be used to discern probabilities or odds.
Example 1.7 Ron and Leslie agree to the following bet. They’ll ask Professor Ross if he has a TikTok account. If he does, Leslie will pay Ron $200; if not, Ron will pay Leslie $100. (Neither has any prior information about whether or not Professor Ross has a TikTok account.)
- Given this setup, which of the following is being judged as more likely: that Professor Ross has a TikTok account, or that he does not? Why?
- What are this bet’s odds?
- Ron and Leslie agree that this is a fair bet, and neither would accept worse odds. What is the subjective probability that Professor Ross has a TikTok account?
- Suppose they were to hypothetically repeat this bet many times, say 3000 times. Given the probability from the previous part, how many times would you expect Leslie to win? To lose? What would you expect Leslie’s net dollar winnings to be? In what sense is this bet “fair”? (Remember: Leslie’s winnings are Ron’s losses and vice versa.)
Solution. to Example 1.7
Show/hide solution
- The larger potential payout corresponds to the less likely event. So Professor Ross is more likely to not have a TikTok account than to have one.
- The payouts are in a 2 to 1 ratio, so the odds that Professor Ross has a TikTok account are 2 to 1 against.
- The odds that Professor Ross has a TikTok account are 2 to 1 against, so Professor Ross is twice as likely to not have a TikTok account than to have one. This corresponds to a subjective probability7 that Professor Ross has a TikTok account of 1/3 (and a probability that he does not have one of 2/3).
- The probability that Leslie wins is 2/3, so you would expect her to win in 2000 of the 3000 repetitions. She wins $100 each time she wins, so you would expect her to win a total of $200,000 on games she wins. The probability that she loses is 1/3, so you would expect her to lose in 1000 of the 3000 repetions. She loses $200 each time, so you would expect her to lose a total of $200,000 on the games she loses. So you would expect Leslie’s net winnings to be 0, and likewise for Ron. The bet is fair in the sense that neither party is expected to profit or lose in the long run.
| Winner | Number of repetitions | Leslie’s winnings per repetition | Leslie’s total winnings |
|---|---|---|---|
| Leslie | 2000 | 100 | 200,000 |
| Ron | 1000 | -200 | -200,000 |
| Total | 3000 | NA | 0 |
The previous example illustrates that the odds of a fair bet on whether or not an event will occur imply a probability for the event.
\[\begin{align*} \text{probability that event occurs} & = \frac{\text{odds in favor of the event}}{1+\text{odds in favor of the event}}\\ & \\ & = \frac{1}{1+\text{odds against the event}} \end{align*}\]
1.3.3 Why do we need consistency?
Regardless of the interpretation — long run relative frequency or subjective — probabilities must follow basic logical consistency requirements. If these requirements are mistakenly not satisfied, bad things can happen.
Example 1.8 Donny Don’t thinks the Dodgers have a pretty good chance to win the World Series. He thinks their only real competition is the Yankees. The following are Donny’s subjective probabilities for which team will win the World Series.
| Team | Probability |
|---|---|
| Los Angeles Dodgers | 50% |
| New York Yankees | 25% |
| Other | 10% |
- What is wrong with Donny’s probabilities?
- What are Donny’s odds that the Dodgers win? (Consider only Donny’s probability that the Dodgers win8.)
- Would Donny agree to a bet where he pays you $100 if the Dodgers win but you pay him $100 if the Dodgers do not win?
- What are Donny’s odds that the Yankees win? Would Donny agree to a bet where he pays you $150 if the Yankees win but you pay him $50 if the Yankees do not win?
- What are Donny’s odds that a team other than the Dodgers or Yankees wins? Would Donny agree to a bet where he pays you $180 if an other team wins but you pay him $20 if the winner is either the Yankees or Dodgers?
- Suppose you and Donny agree to make all of the bets in the three previous parts. Consider your net profit for each of the potential outcomes (Dodgers win, Yankees win, other wins). What do you notice? Who would you rather be in this situation: you or Donny?
Solution. to Example 1.8
Show/hide solution
Donny’s probabilities do not add up to 100%.
Donny’s odds that the Dodgers win are \(\frac{0.5}{0.5}=1\), or even odds.
Donny believes that the Dodgers are equally likely to win as to not win so, yes, he would agree to this bet with even payouts.
Donny’s odds that the Yankees do not win are \(\frac{0.75}{0.25}=3\), or 3 to 1 odds against the Yankees winning. Donny believes that the Yankees are 3 times more likely to not win than to win. Since the payouts are in a 3 to 1 ratio with the larger payout corresponding to the Yankees winning (the less likely event), then Donny would agree to this bet.
Donny’s odds that an other team does not win are \(\frac{0.9}{0.1}=9\), or 9 to 1 odds against an other team winning. Donny believes that an other team is 9 times more likely to not win than to win. Since the payouts are in a 9 to 1 ratio with the larger payout corresponding to an other team winning (the less likely event), then Donny would agree to this bet.
Given Donny’s odds for each outcome, he would agree to each of these bets.
- If the Dodgers win, you win the first bet but lose the other two, so your net profit is 100 - 50 - 20 = 30.
- If the Yankees win, you win the second bet but lose the other two, so your net profit is 150 - 100 - 20 = 30
- If an other team wins, you win the third bet but lose the other two, so your net profit is 180 - 100 - 50 = 30.
Regardless of the outcome, you are guaranteed to earn a net profit of $30, and Donny is guaranteed to lose a net of $30. That’s free money for you with no risk, and pretty bad business on Donny’s part.
The previous problem contained an example of a “Dutch book”. A Dutch book9 is a set of probabilities and bets which guarantees a profit, regardless of the outcome of the gamble. Probabilities that fail to satisfy logical consistency requirements allow for the possibility of Dutch books. The fact that no one should ever want to get caught in a Dutch book, like Donny was in the previous problem, is one justification of why even subjective probabilities should satisfy logical consistency requirements.
1.3.4 Exercises
Various sources post odds for who will win the 2024 U.S. Presidential Election. As of July 28, 2021, the website bonus.com lists the following probabilities.
Potential candidate Probability of winning 2024 election Joe Biden 20.0% Kamala Harris 16.7% Donald Trump 12.5% Nikki Haley 7.7% Ron DeSantis 7.7% - According to bonus.com, what is the probability that either Joe Biden or Kamala Harris wins the 2024 election?
- According to bonus.com, what is the probability that someone other than these five people wins the 2024 election?
- According to bonus.com, what are the odds that Joe Biden wins the 2024 election?
- Suppose that a source gives Dwayne Johnson 500 to 1 odds of winning. What is the probability that Dwayne Johnson wins?
Suppose your subjective probabilities for who will win the 2024 U.S. Presidential Election satisfy the following.
- Joe Biden is 5 times more likely to win than Kamala Harris, and no other Democratic candidate has a chance of winning
- The Democratic candidate and the Republican candidate are equally likely to be the winner
- Donald Trump is twice as likely to win as any other Republican candidate.
Create a table of your subjective probabilities.
We focus on odds as a ratio of probabilities to illustrate relative likelihoods; these are called “fractional odds”. But odds can be reported in other ways. In particular, “moneyline odds” (a.k.a., “American odds”) are expressed in terms of the net profit on a 100 dollar bet. For example, in Example 1.4 the moneyline odds for the Dodgers are +400. This means that someone who bets 100 dollars on the Dodgers to win the World Series would win 500 dollars if the Dodgers actually win, for a net profit of +400 dollars after subtracting the initial stake of 100 dollars. The amounts 400 and 100 are in a 4 to 1 ratio, implying a probability of \(1/(1+4) = 0.20\).↩︎
Technically, Ron and Leslie could still have different subjective probabilities. Leslie would not agree to worse odds, but she would accept better if Ron offered them. For example, given a potential loss of $200, Leslie would also agree to a potential payout from Ron of $125 rather than $100. That is, Leslie would accept odds of 1.6 to 1 against (\(200/125 = 1.6\)), corresponding to a subjective probability of 0.385 (\(1/(1 + 1.6)\)) . So Leslie’s subjective probability that Professor Ross has a TikTok account is at least 1/3. Similarly, Ron’s subjective probability that Professor Ross has a TikTok account is at most 1/3.↩︎
We’re assuming Donny’s probability that the Dodgers don’t win is 50%. But if Donny’s probabilities don’t add to 100% why would we expect him to obey other consistency requirements? A fair question, but the point is that bad things can happen even if just one of the consistency requirements is violated.↩︎
“Book” in the sense of a bookie taking bets, as opposed to a Dutch-language novel like De ontdekking van de hemel.↩︎