3.8 Optional: Interpreting histograms
This question is optional; e.g., if you need more practice, or you are studying for the exam.
(Answers are available in Sect. A.4)
To assess various lung diseases, many methods are available (including using a spirometer and the 6-minute walk test). The fatigue assessment scale (FAS) is one way to measure the fatigue of the patient. (A high FAS value means more fatigue (Michielsen et al. 2003).)
The histogram in Fig. 3.3 comes from a study (Baughman et al. 2007) examining n=142 sarcoidosis patients using the FAS.
- Critique this histogram. Identify ways to improve the histogram.
- Describe this histogram in words: what does it tell you?
- Draw a rough boxplot that corresponds approximately to the histogram, explaining your reasoning.
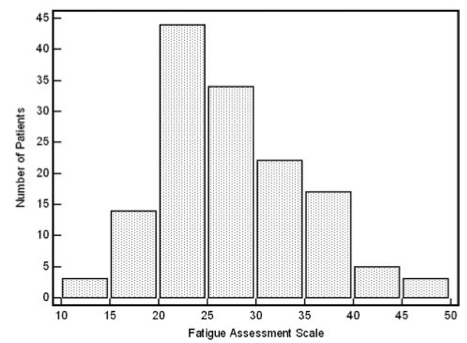
FIGURE 3.3: The histogram of FAS scores for patients
References
Baughman RP, Sparkman BK, Lower EE. Six-minute walk test and health status assessment in sarcoidosis. Chest. 2007;132(1):207–13.
Michielsen HJ, De Vries J, Van Heck GL. Psychometric qualities of a brief self-rated fatigue measure The Fatigue Assessment Scale. Journal of Psychosomatic Research. 2003;54:345–52.