10.4 CIs and tests for ORs
Singh and Prasad (2016) examined the mortality rates of lower-limb amputation, and factors that may be associated with mortality. As part of the study, the researchers recorded the five-year mortality rate (the number of amputees who died within five years of amputation) and whether or not the person used an artificial limb.
The RQ was:
For this type of amputees, is the odds of being alive after five years the same for those who used an artificial limb, and those who did not?
A total of \(105\) subjects were used: \(35\) died within five years, and \(70\) were still alive after five years. In addition, \(65\) subjects used an artificial limb, and \(40\) did not.
- After five years, \(49\) people using an artificial limb were alive. Construct the \(2\times 2\) table (Table 10.3) displaying the number of people alive or dead after five years (in columns, say) and whether or not they used an artificial limb or not (in rows).
| Alive | Dead | Total | |
|---|---|---|---|
| Used artificial limb | |||
| Did not use artificial limb | |||
| Total | 105 |
In Table 10.3, why is the use (or not) of artificial limbs listed in the rows (rather than the columns)?
For a person using an artificial limb, compute the odds of being alive after five years. For a person not using an artificial limb, compute the odds of being alive after five years. Then compute the odds ratio, complete Table 10.4, and carefully explain what the OR means.
Write down the \(95\)% CI for the population OR using the software output (Fig. 10.3).
Perform a hypothesis test to compare the odds of being alive after five years for both groups (Fig. 10.3):
- Write the hypotheses.
- Write down the value of \(\chi^2\).
- What \(z\)-score is this equivalent to?
- What is the approximate \(P\)-value using the \(68\)--\(95\)--\(99.7\) rule?
- What is the exact \(P\)-value as reported by software?
- Write a conclusion.
| after 5 years | after 5 years | size | |
|---|---|---|---|
| Use artificial limb | |||
| Did not use artifical limb | |||
| Diff in proportions: | OR: |
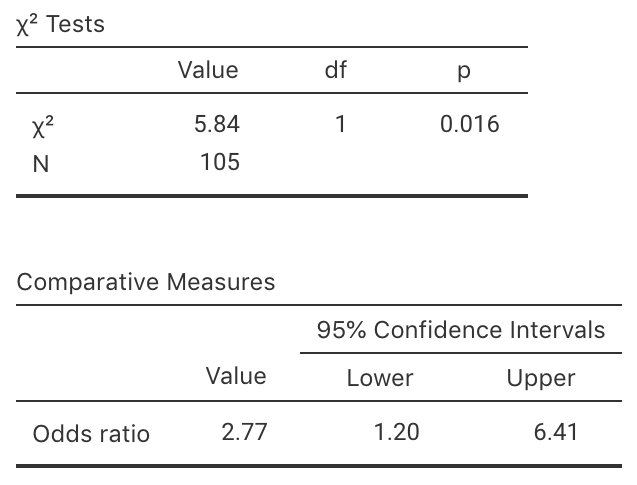
FIGURE 10.3: The jamovi output for the question on lower-limb amputees.