8.6 Optional questions
These questions are optional; e.g., if you need more practice, or you are studying for the exam. (Answers appear in Sect. A.8.)
8.6.1 (Optional) Tests for one mean
This question has a video solution in the online book, so you can hear and see the solution.
Shortly after metric units were introduced to Australia in 1977, a lecturer wondered how accurately students could estimate lengths using the metric measurements (Hand et al. 1996). The aim of the study was to determine if, on average, students could correctly guess the width of the hall (which was \(13.1\,\text{m}\)).
To answer the RQ, a group of \(n = 44\) students were asked to estimate the width of the lecture hall to the nearest metre (data provided by Prof. Lewis). The data are given in Table 8.1.
The data were entered into software, producing the output in Fig. 8.4 (jamovi).
| 8 | 9 | 10 | 10 | 10 | 10 | 10 | 10 | 11 | 11 | 11 | 11 | 12 | 12 | 13 |
| 13 | 13 | 14 | 14 | 14 | 15 | 15 | 15 | 15 | 15 | 15 | 15 | 15 | 16 | 16 |
| 16 | 17 | 17 | 17 | 17 | 18 | 18 | 20 | 22 | 25 | 27 | 35 | 38 | 40 |
- What are the values of \(s\) and \(\text{s.e.}(\bar{x})\)? Explain the difference in the meaning of the two terms.
- Perform a hypothesis test to determine if the mean guess is the actual distance of \(13.1]ms\). (The CI was computed in Sect. 7.7.2.)
- Is it reasonable to assume the conditions are satisfied? How does Fig. 8.3 help, if at all?
- Do you think students were very good at estimating the width of the hall using metric units?
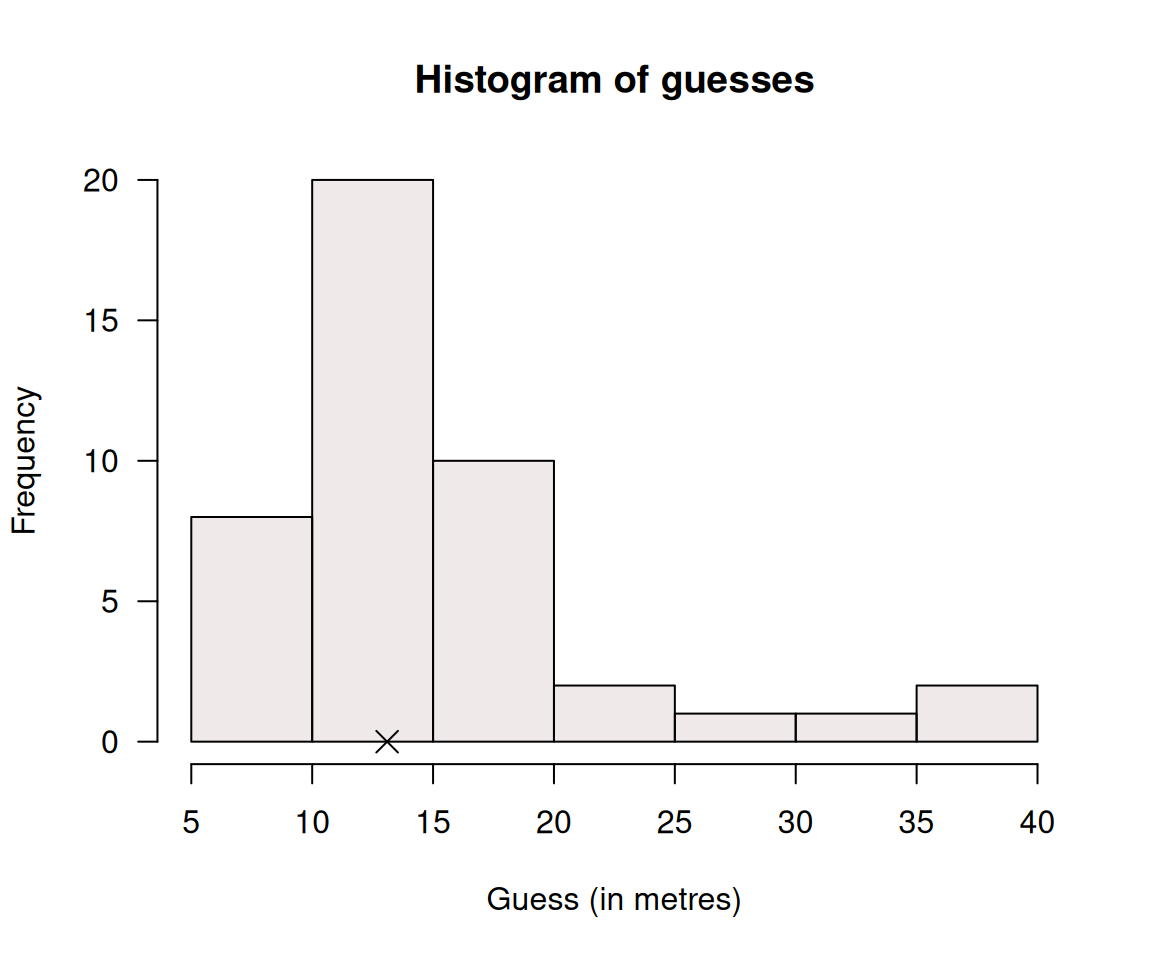
FIGURE 8.3: Histogram for the estimates of the width of a hall. The actual width is shown by a cross.
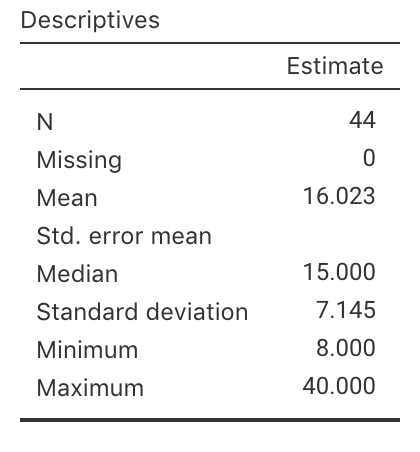
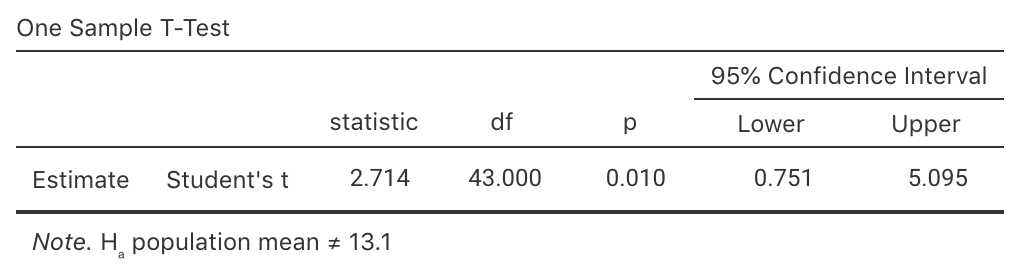
FIGURE 8.4: jamovi numerical summary output for the estimates of the width of a hall in metres.