10.3 CI and test for odds ratios

The timing of pubertal maturation can vary, which can have impacts upon behaviour. Duncan et al. (1985) studied 'the relationships between maturational timing and body image, school behavior, and deviance.' Sample data were collected from
...children and youth of the entire United States drawn by the National Center for Health Statistics... known as the National Health Examination Survey (1966--1970). Data were collected on... adolescents' physical and psychological status...
The researchers asked the RQ;
For US children, is the odds of a boy maturing late the same as the odds of a girl maturing late?
Part of the data are shown entered into jamovi (Fig. 10.1)
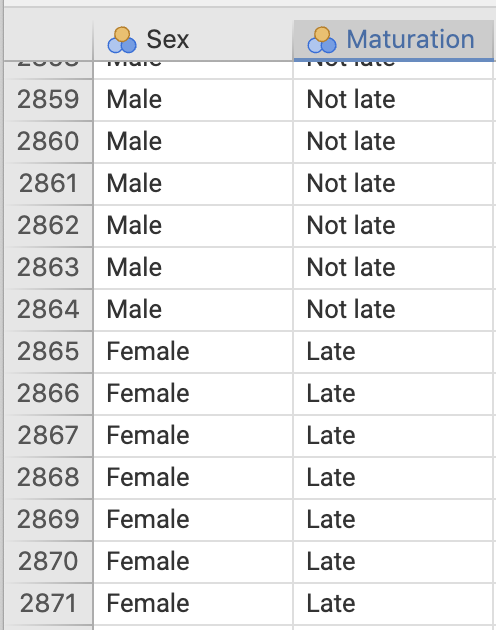
FIGURE 10.1: Some of the maturation-data entered into jamovi.
- For the \(2\,864\) males in the sample, \(352\) were classified as maturing late.
For the girls, \(336\) of the \(2\,664\) matured late. Use this information to construct a two-way table of sex against maturation time (Table 10.1).
| Matured late | Did not mature late | Total | |
|---|---|---|---|
| Males | |||
| Females | |||
| Total | 5528 |
What graphical summary could be used to display the information? Sketch this display.
Among the boys, compute the odds of maturing late. Interpret this value.
Among the girls, compute the odds of maturing late. Interpret this value.
From the table, compute the odds ratio of a boy maturing late compared to a girl maturing late. Interpret this value, using the software output (Fig. 10.2).
What is the parameter of interest (make sure you specify the direction)?
Write down the OR and the \(95\)% CI for the OR from the jamovi output. What does it mean?
Compile the numerical summary table for these data (Table 10.2).
Are boys generally more likely to mature later than girls? Perform a hypothesis test.
Vote below.
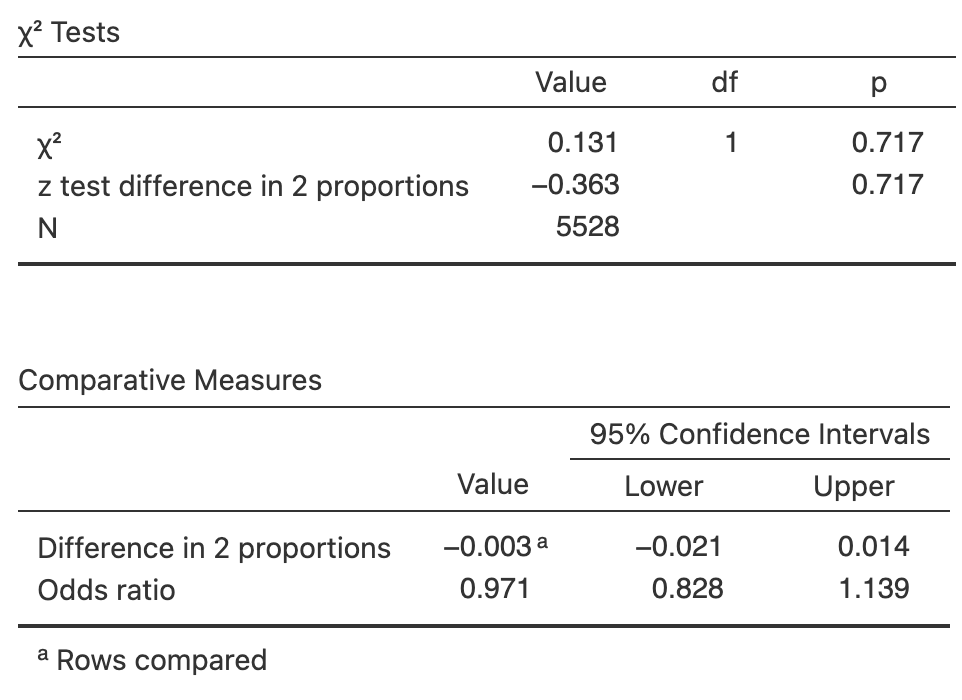
FIGURE 10.2: The jamovi output from the maturation study
| Proportion maturing late | Odds maturing late | Sample size | |
|---|---|---|---|
| Males | |||
| Females | |||
| Diff: | OR: |