6.3 Normal distributions and heights
In the (NNS) (conducted with the 1995 National Health Survey (NHS)), trained nutritionists measured the heights of the respondents (Australian Bureau of Statistics 1995).
The values quoted are the population means \(\mu\) and standard deviations \(\sigma\) of the models used for heights.
- Take a wild guess: What percentage of your peers (people your age and gender) do you think would be shorter than you? %.
- Write down your own height: cm.
- From Fig. 6.1, write down the mean and standard deviation for people in your age group and gender. Using this information, compute the \(z\)-score for your height, relative to people in your age group and gender. Explain what this means.
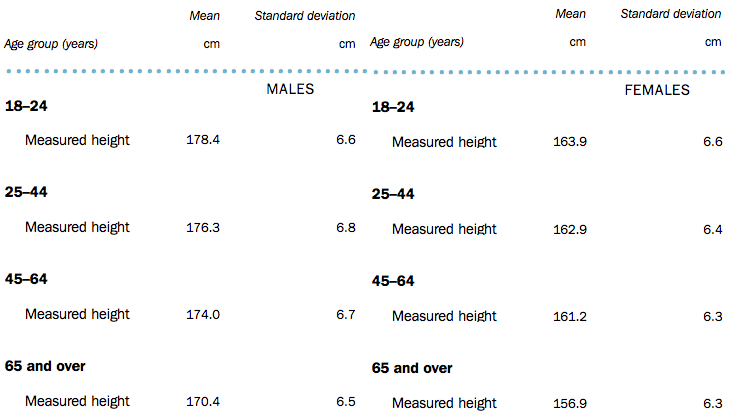
FIGURE 6.1: Part of the ABS report on heights of Australians.
Heights have an approximate normal (bell-shape) distribution, so the \(68\)--\(95\)--\(99.7\) rule applies.
Using the \(68\)--\(95\)--\(99.7\) rule, roughly estimate the percentage of people of your age and gender that are shorter than you. (Hint: Draw a picture!)Using the normal distribution tables in the Appendix, together with the information from Fig. 6.1, compute the percentage of people of your age and gender that are shorter than you.
Using the \(68\)--\(95\)--\(99.7\) rule, the middle \(95\)% of females \(18\) and over are within what height range? (For this group, the mean is \(\mu = 161.4\,\text{cm}\), and the standard deviation is \(\sigma = 6.7\,\text{cm}\), drawn from Fig. 6.1.)
For this part, we want to just look at females \(18\) and over again. Answer the following questions.
- Compute the percentage of females \(18\) and over that are shorter than \(171\,\text{cm}\).
- What are the odds that a female \(18\) and over is shorter than \(171\,\text{cm}\)?
- Compute the percentage of females \(18\) and over that are taller than \(171\,\text{cm}\)?
- What are the odds that a female \(18\) and over is taller than \(171\,\text{cm}\)?
- Compute the percentage of females \(18\) and over that are between \(170\) and \(180\,\text{cm}\)?
- What are the odds that a female \(18\) and over is between \(170\) and \(180\,\text{cm}\)?
Approximately \(20\)% of females \(18\) and over are shorter than what height?