4.3 Two-way tables

Soccer (football) is a unique in that one aspect is 'the purposeful use of the unprotected head for controlling and advancing the ball' (Kirkendall et al. 2001). Some researchers suspect that repeatedly 'heading' the ball may impair brain function.
A study (Kirkendall et al. 2001) was conducted to determine (p. 157)
...whether long-term or chronic neuropsychological dysfunction (i.e. concussion) was present in collegiate soccer players
Data were collected from \(240\) college students for two variables:
- The student type: one of 'soccer player', 'non-soccer athlete', or 'non-athlete'.
- The number of head concussions: each student was asked about the number of head concussions they had experienced; 'zero' , 'one', or 'two or more' concussions.
Use the study data (Table 4.3) to answer the following questions.
| 0 | 1 | 2 or more | Total | |
|---|---|---|---|---|
| Soccer players | \(\phantom{0}45\) | \(\phantom{0}\phantom{0}5\) | \(\phantom{0}13\) | \(\phantom{0}63\) |
| Non-soccer athletes | \(\phantom{0}68\) | \(\phantom{0}25\) | \(\phantom{0}\phantom{0}3\) | \(\phantom{0}96\) |
| Non-athletes | \(\phantom{0}45\) | \(\phantom{0}15\) | \(\phantom{0}21\) | \(\phantom{0}81\) |
| Total | \(158\) | \(\phantom{0}45\) | \(\phantom{0}37\) | \(240\) |
- Why is the number of concussions placed in the columns of the table, rather than the rows?
- Classify the two variables.
- Compute the percentage of college students in the sample that have received exactly one concussion.
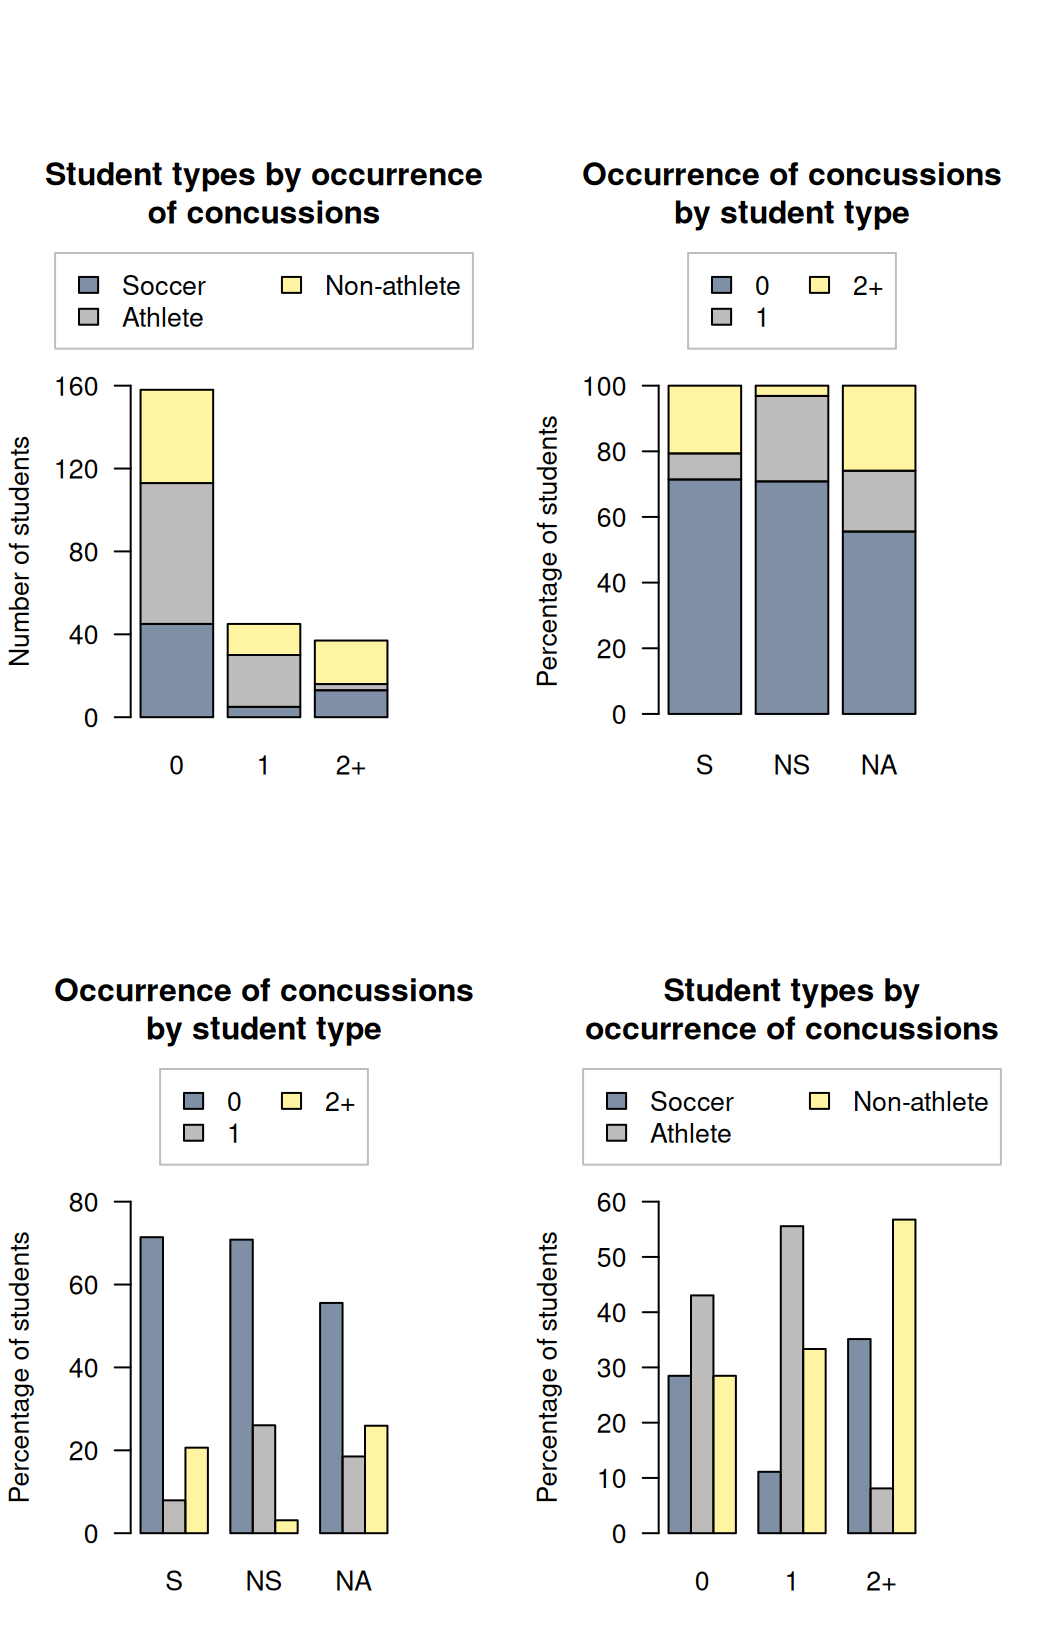
- Many possible graphs exists to display the data; four are shown in Fig. 4.2. What is the main message from each graph? Which graph do you think is best? Why?
- Among non-athletes, compute the odds of receiving two or more concussions. Interpret what this means.
- Among soccer players, compute the odds of receiving two or more concussions. Interpret what this means.
- Compute the odds ratio comparing the odds of a non-athlete receiving two or more concussions to the odds of a soccer player receiving two or more concussions.
- Create a table of column percentages. What do these tell you?
- Create a table of row percentages. What do these tell you?
- Which one of these tables is probably more sensible, and why?

FIGURE 4.2: Four different graphs displaying the soccer-data. 'S' mean a soccer player; 'NS' means a non-soccer athlete; 'NA' means a non-athlete.
References
Kirkendall DT, Jordan SE, Garrett WE. Heading and head injuries in soccer. Sports Medicine. Springer; 2001;31(5):369–86.