3.6 Interpreting graphs
A study of Weddell seals (Bryden et al. 1984) measured, among other things, body length. A histogram of the body length of \(90\) female seals is shown in Fig. 3.2.
- Describe this histogram in words (average; variation; shape; outliers).
- What alternative graphical displays could be used to display these data?
- Critique the graph.
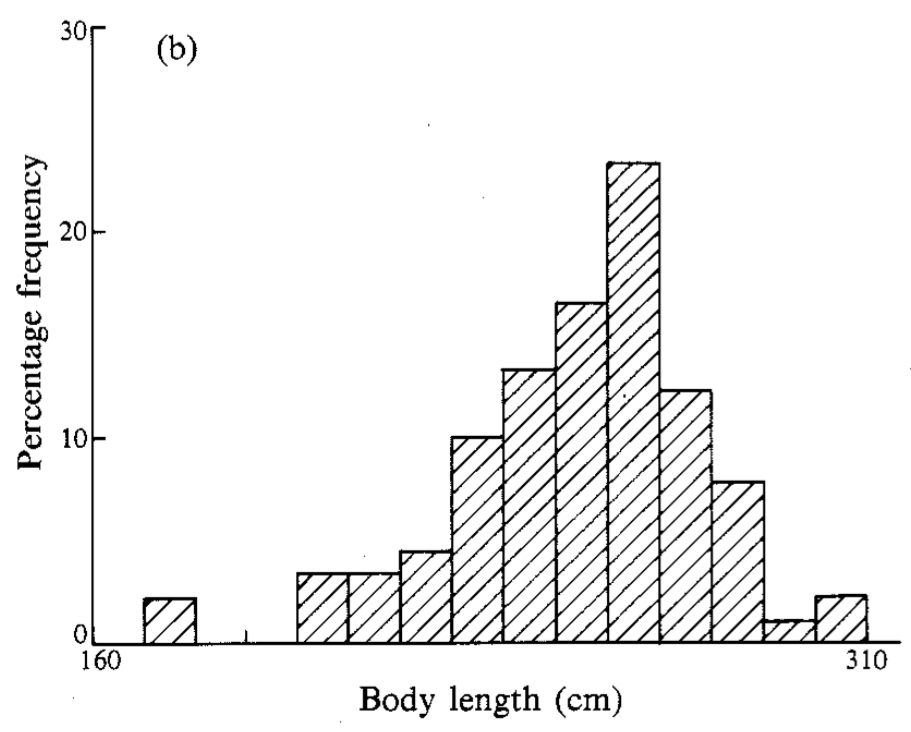
FIGURE 3.2: A histogram of the body length of female Weddell seals
References
Bryden MM, Smith MSR, Tedman RA, Featherston DW. Growth of the Weddell seal, Leptonychotes weddelli (Pinnipedia). Australian Journal of Zoology. 1984;32:33–41.