5.7 Optional questions
These questions are optional; e.g., if you need more practice, or you are studying for the exam. (Answers appear in Sect. A.5.)
5.7.1 (Optional) Understanding RQs and variables
Radziun et al. (2023) compared the mean accuracy with which blind and sighted individuals could count their heartbeats over varying time periods. For the study, sighted subjects were blindfolded (p. 3). The participants were instructed (p. 4):
Without manually checking, can you silently count each heartbeat you feel in your body from the time you hear 'start' to when you hear 'stop'? Do not take your pulse or feel on your chest with your hand. You are only allowed to feel the sensation of your heart beating.
The process was repeated using time intervals of \(25\), \(30\), \(35\), \(40\), \(45\), and \(50\,\text{s}\). The time intervals were presented in random order to the subjects (\(34\) blind; \(36\) sighted), who received no information about the length of the time interval.
Each subject was assigned a single accuracy score (from \(0\) to \(1\) (perfect accuracy)) by combining their results across the various time intervals. The study, therefore, compared the average accuracy scores blind people to sighted people.
- What type of RQ is this?
- What type of study is this?
- What are the Outcome and the response variable in this study?
- What are the Comparison and the explanatory variable in this study?
- Is there an intervention? Explain.
- Describe the response variable (e.g., qualitative nominal; quantitative discrete).
- Describe the explanatory variable (e.g., qualitative nominal; quantitative discrete).
- What graph would be used to display the relationship?
- What are the units of analysis?
- How many units of analysis are there?
- How many units of observation are there for each unit of analysis?
5.7.2 (Optional) Interpreting and drawing boxplots
Environmentally-friendly buildings are often assumed to have a better indoor environmental quality (when occupants rate the comfort) than conventional buildings; in turn, this is assumed to have a positive impact on productivity.
One group of researchers decided to test this assertion. Figure 5.9 is taken from a study of office temperatures (Paul and Taylor 2008) in an environmentally-friendly building at Charles Sturt University.
Operative temperatures were measured in three offices between 8am to 6pm during four weeks near the end of summer; Office A is located on the ground floor, while Offices B and C are located on the top floor. The building is not air conditioned.
- Use this information to construct a boxplot of the range of office temperatures for the three offices.
- In words, describe the relationship.
- Do the offices appear to provide a 'comfortable' temperature?
- Suppose we wanted to compare ground floor offices to top floor offices. How many units of analysis would we have for this comparison?

FIGURE 5.9: Table 1 from Paul et al. (2008)
5.7.4 (Optional) Identifying appropriate graphs
In each of the following cases:
- Identify the variables;
- Identify what type of variables these are; and
- Hence determine and justify the most appropriate graph for displaying the relationship of interest.
In addition, draw a rough example of what the graph may look like.
Meadowfoam is a plant from which oil can be extracted from its flowers, so maximising flowering is important.
Seddigh and Joliff (1994) examined many individual meadowfoam plants and explored the relationship between the number of flowers each plant produced, and the number of hours of light each plant received.
Early in the \(21\)st century, moves were made to ban smoking in outdoor areas of restaurants, cafes, pubs and bars. However, some people thought this was unnecessary, as they believed that exposure to second-hand smoke was minimal.
To study this phenomenon and to inform public policy, Stafford et al. (2010) examined numerous al fresco (open air) restaurants in New Zealand.
They collected two pieces of information from each individual restaurant: the number of smokers present at the restaurant at the time of observation (restaurants with no smokers; restaurants with one smoker; restaurants with two or more smokers), and the concentrations of fine particulate matter (PM) measured in the restaurant air at the same time. The researchers wish to compare the PM concentrations across the three groups.
To understand the usage of hospital emergency departments (EDs) in Ireland, Curran et al. (2011) examined many individual admissions.
For each admission to the ED, they recorded if the waiting time was short (within \(3\,\text{h}\)) or long (\(3\,\text{h}\) or longer), and the time of day of the admission (in three divisions: \(9\)am to \(5\)pm; \(5\)pm to midnight; and midnight to \(9\)am).
Stress in children is not as well understood as stress in adults.
To examine the issue, Saunders et al. (1999) studied many children, and for each child they determined each child's level of playfulness (measured using a quantitative scale called the Test of Playfulness) and each child's level of 'coping' (measured using a quantitative scale called the Coping Inventory).
5.7.6 (Optional) Evaluating graphics
A study of the impact of ants on plant communities (Sankovitz et al. 2018) produced the boxplot in Fig. 5.10, showing the percentage of land covered by plants next to the ant nest, uphill from the ant nest, and downhill from the ant nest.
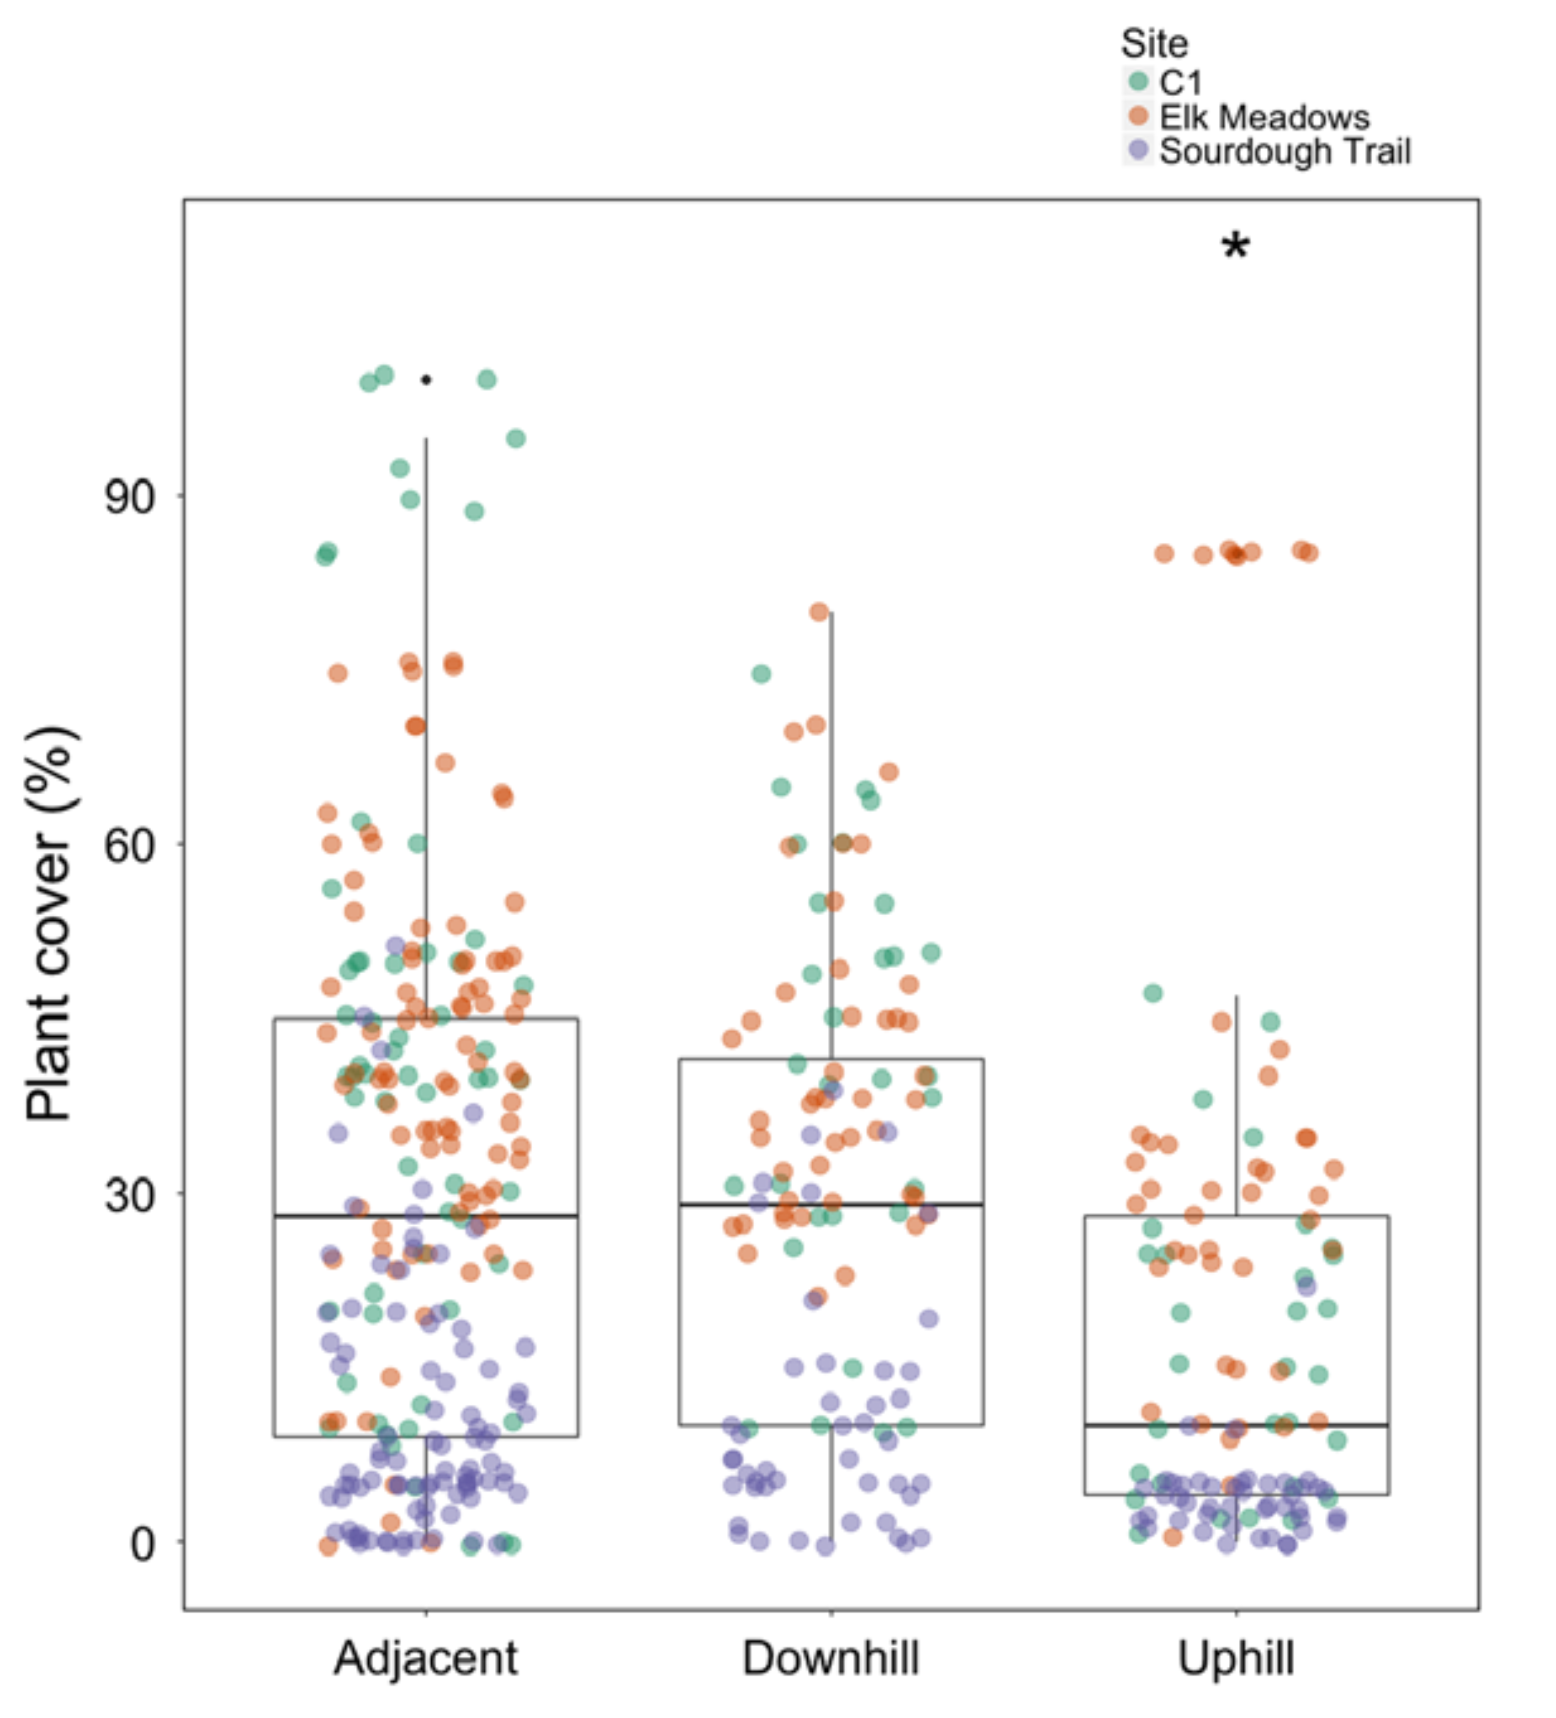
FIGURE 5.10: A graphic from Sankovitz et al. (2018
- Identify the type of study: experimental or observational.
- Identify the units of observation, and the units of analysis.
- Critique this graph.
- Do you think that a real difference exists between median plant coverage at different locations around the ant nest? What other interesting features can be seen from the graph?
5.7.7 (Optional) Evaluating graphics
Jennings et al. (2012) studied patients in severe pain and compared two different treatments to determine which to recommend. Patients were randomly allocated to receive one of two pain treatments: either morphine, or morphine and ketamine.
The pain reduction for each patient was then measured (using the 'pain verbal numeric rating scale': \(0\) is no pain, and \(10\) the worst pain imaginable, such as Australia losing the Ashes), by taking pain measurements before and after giving the treatment.
The graph in Fig. 5.11 summarises the data.
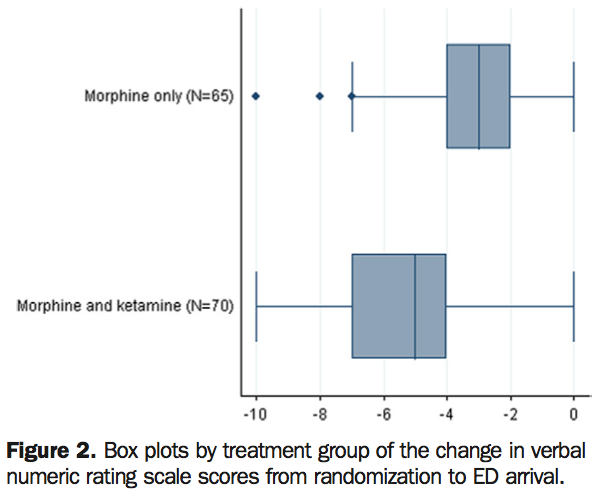
FIGURE 5.11: A graphic from Jennings et al. (2002). 'ED' means 'Emergency Department'
- Identify the type of study: experimental or observational.
- Identify the units of observation, and the units of analysis.
- Critique this graph.
- What do you think the negative numbers on the graph mean?
- Do you think that a real difference exists between the median for the two treatments in the population? Explain