9.5 CIs and test for difference between two sample means

Researchers were interested in the impact of diet on the lifetime of rats:
For rats, is the mean lifetime shorter for rats on a free-choice diet compared to rats on a healthy, restricted diet?
Berger et al. (1988) compared the lifetime of rats on a healthy, restricted diet (\(106\) rats) and on a free-eating diet (\(89\) rats). The data set is large, so we only show an extract of the data (Fig. 9.5).
Explain why this study compares two independent groups.
Carefully define parameter of interest, including the direction. What does this definition of the difference measure?
Use the jamovi output (Fig. 9.7) to prepare a numerical summary table.
Use the jamovi output to write down the appropriate \(95\)% CI, to estimate the difference between the population means.
Which of these short statements best communicates this CI? Why are the other statements incorrect?
- The sample mean lifetime is between \(223.34\) and \(346.13\) days.
- The difference between the population mean lifetimes is between \(223.34\) and \(346.13\) days.
- We are \(95\)% sure that the difference between the sample mean lifetimes is between \(223.34\) and \(346.13\) days.
- We are \(95\)% sure that the difference between the population mean lifetimes is between \(223.34\) and \(346.13\) days.
- If we repeated everything many times, \(95\)% of the CIs constructed would contain the difference between the population means.
The above statement communicating the CI isn't perfect. Why not? Write an improved statement communicating the CI.
Explain the difference between the meaning of what is displayed in the two graphs in Fig. 9.6.
Write down the hypotheses being tested. Is this a one- or a two-tailed test? Explain.
What are two possible reasons why the sample mean lifetimes of rats on the two diets are different?
Write down the \(t\)-score and the appropriate \(P\)-value, using the output in Fig. 9.7 .
Calculate the \(t\)-score (using the standard error as given in the output), and show it is the same value as given in the output.
Make a conclusion, in context.
What conditions are necessary for the CI and test to be statistically valid?
Is it reasonable to assume these conditions are satisfied? How does Fig. 9.6. help, if at all?
What if all these rats only came from only \(20\) litters?
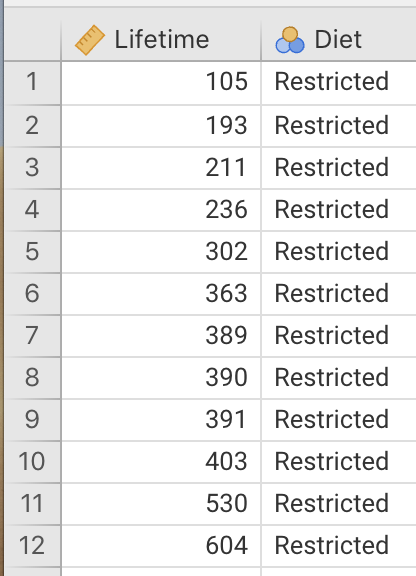
FIGURE 9.5: Part of the data for the rat lifetime example.
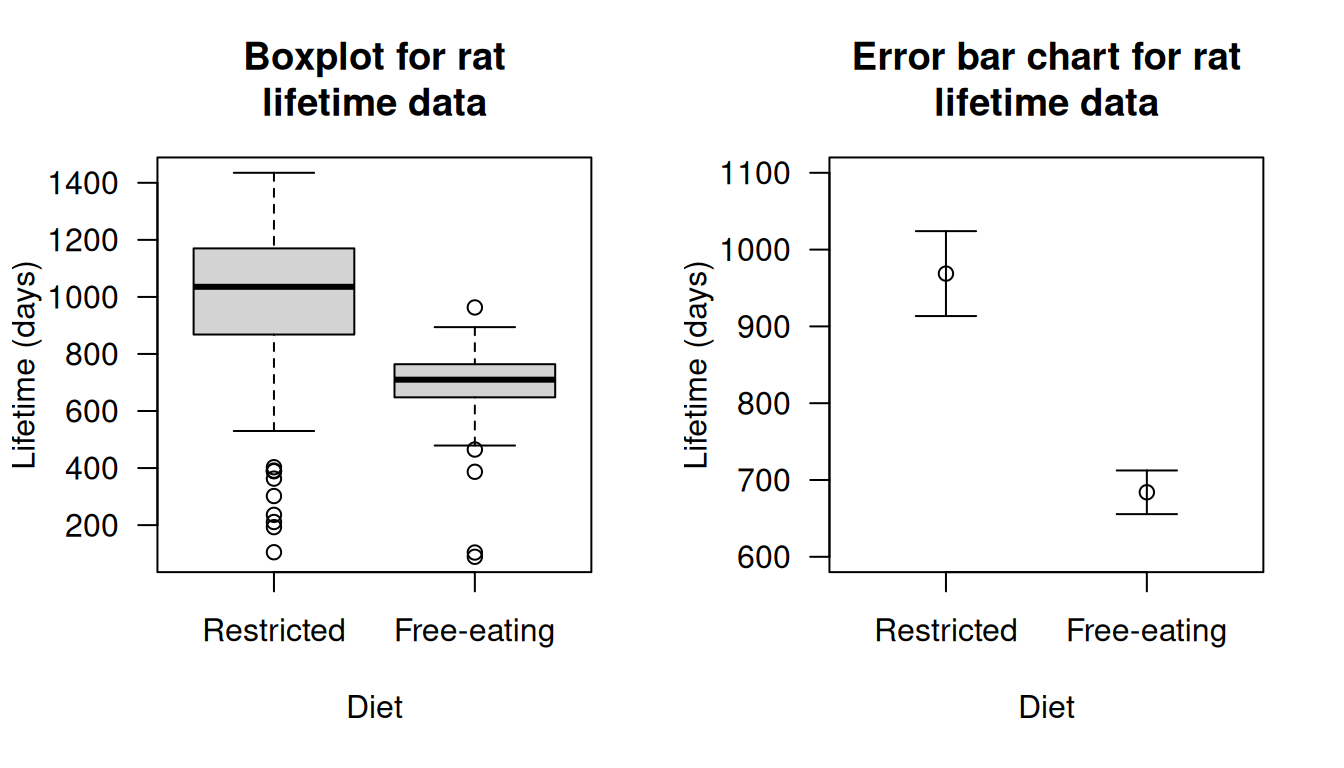
FIGURE 9.6: Boxplot (left panel) and error-bar chart (right panel) for the rat lifetime data.
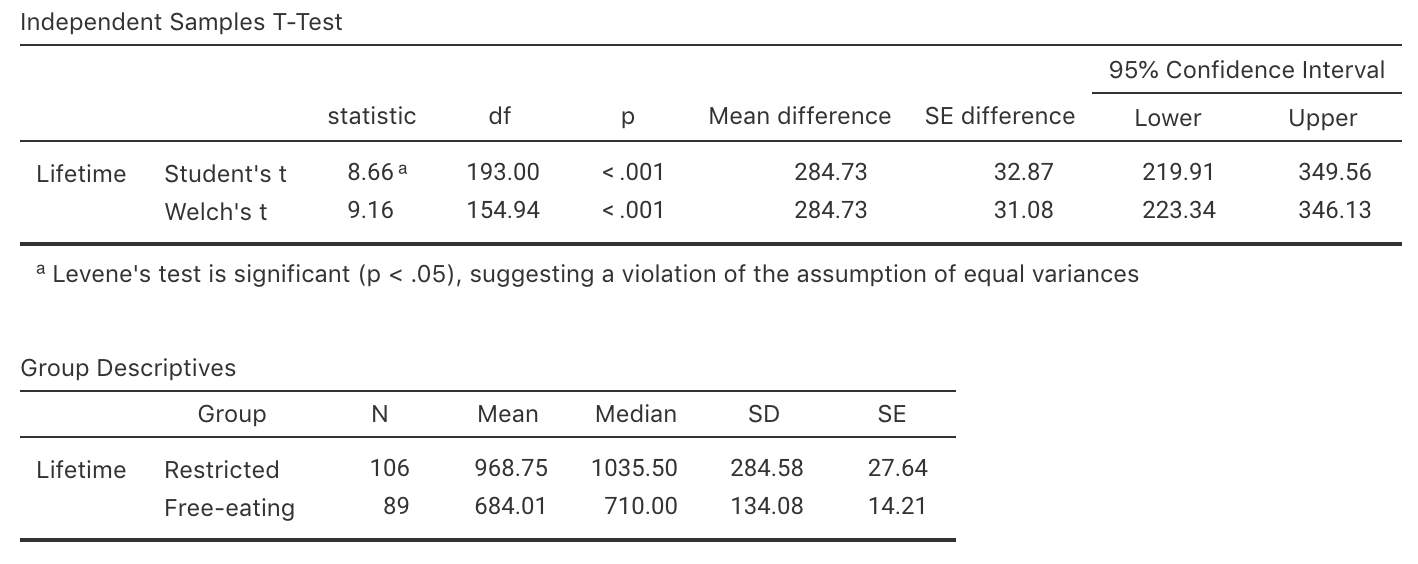
FIGURE 9.7: The jamovi output summarising the rat lifetimes data.