7.5 CIs for one mean

In 2011, Eagle Boys Pizza ran a campaign that claimed (among many other claims) that Eagle Boys pizzas were 'Real size \(12\)-inch large pizzas' in an effort to out-market Dominos Pizza.
Eagle Boy's made the data behind the campaign publicly available (Dunn 2012). A summary of the diameters of a sample of \(125\) of Eagle Boys' large pizzas is shown in Fig. 7.2.
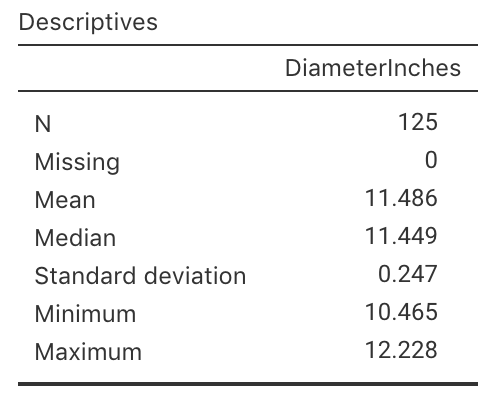
FIGURE 7.2: Summary statistics for the diameter of Eagle Boys' large pizzas; jamovi.
What do \(\mu\) and \(\bar{x}\) represent in this context?
Write down the values of \(\mu\) and \(\bar{x}\).
Write down the values of \(\sigma\) and \(s\).
Compute the value of the standard error of the mean.
Explain the difference in meaning between \(s\) and \(\text{s.e.}(\bar{x})\) here.
If someone else takes a sample of \(125\) Eagle Boys pizzas, will the sample mean be \(11.486\) inches again (as it is in this sample)? Why or why not?
Draw a picture of the approximate sampling distribution for \(\bar{x}\).
Compute an approximate \(95\)% confidence interval for the mean pizza diameter.
Write a statement that communicates your \(95\)% CI for the mean pizza diameter.
What are the statistical validity conditions?
Which of these conditions must we assume are met for this CI to be statistically valid? How does Fig. 7.3 help, if at all? Explain.
- The sample size is greater than about \(25\).
- The population has a normal distribution.
- The population standard deviation is known.
- The sample has a normal distribution.
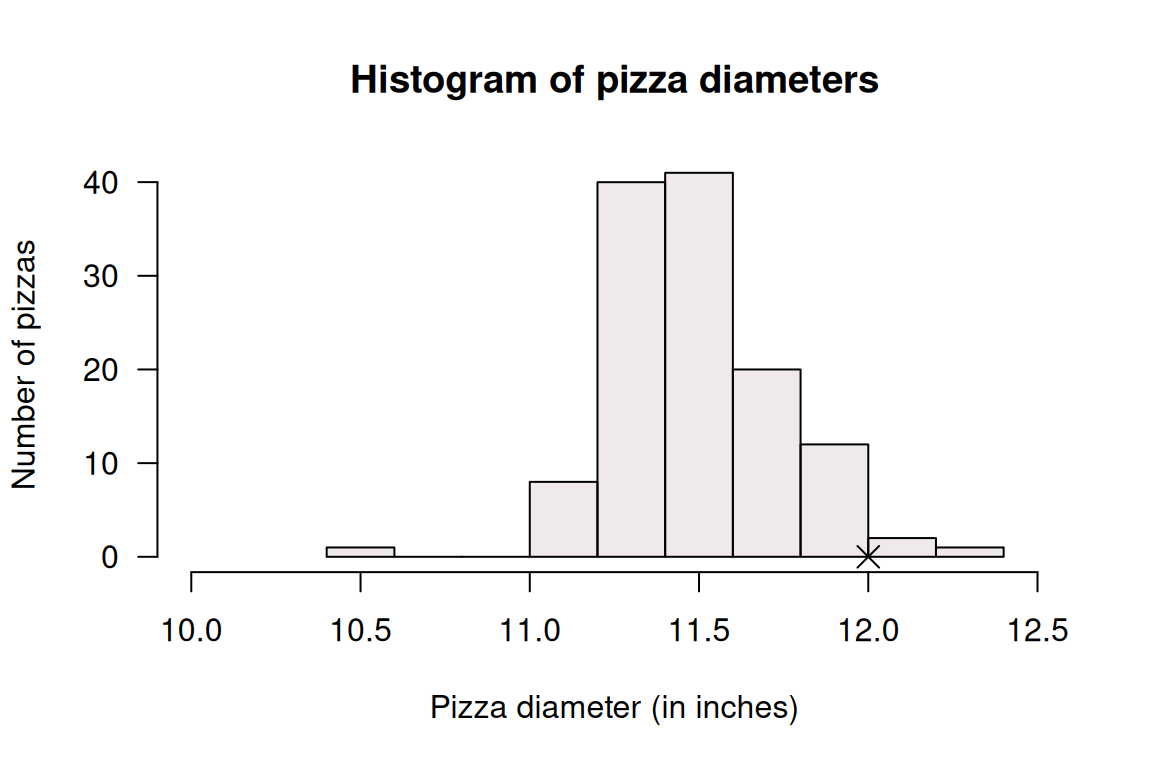
FIGURE 7.3: Histogram for the diameter of Eagle Boys' large pizzas. The cross is the claimed diameter of 12 inches.
- Do you think that, on average, the pizzas do have a mean diameter of \(12\) inches in the population, as Eagle Boy's claim? Explain.