5.3 Critiquing students' graphs
In this activity, you get to critique actual SCI110 Project submissions, so you can critique your own before submission.
- Critique the graph in Fig. 5.5, a screenshot from a student Project Report comparing the average burn time between two brands of sparklers.
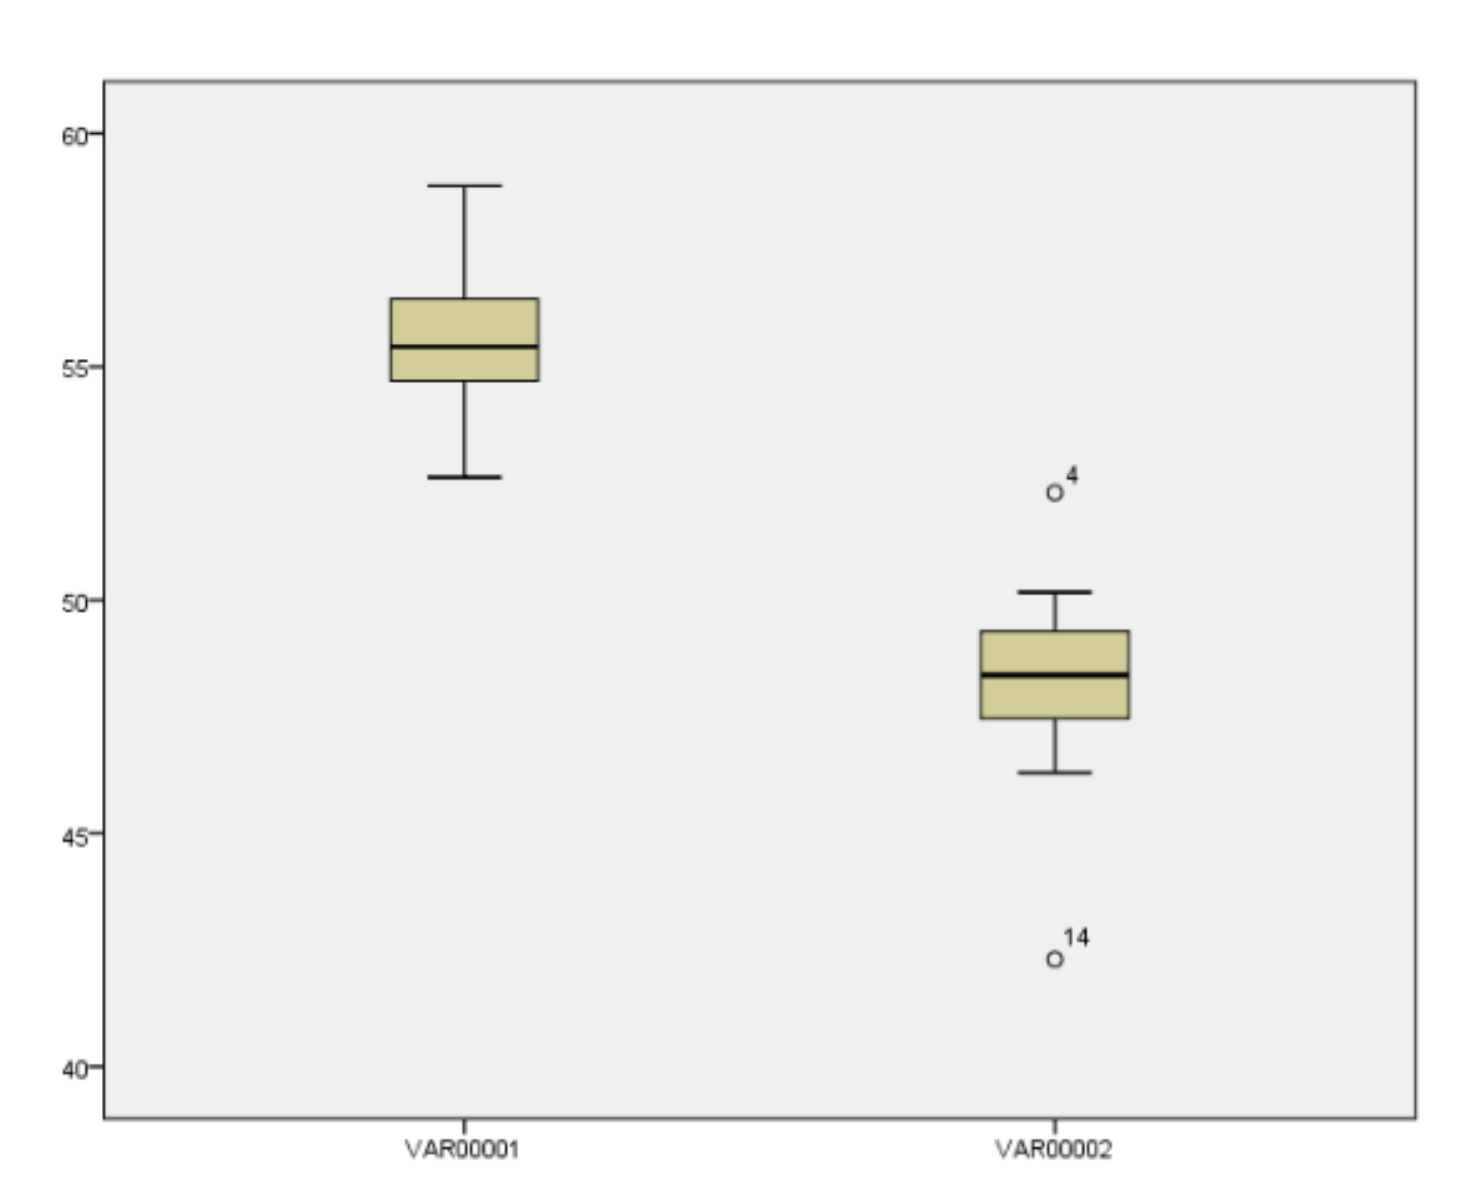
FIGURE 5.5: A graph from a student Project.
- Critique the graph in Fig. 5.6, a screenshot from a student Project Report comparing the average burn time of room-temperature and refrigerated candles.
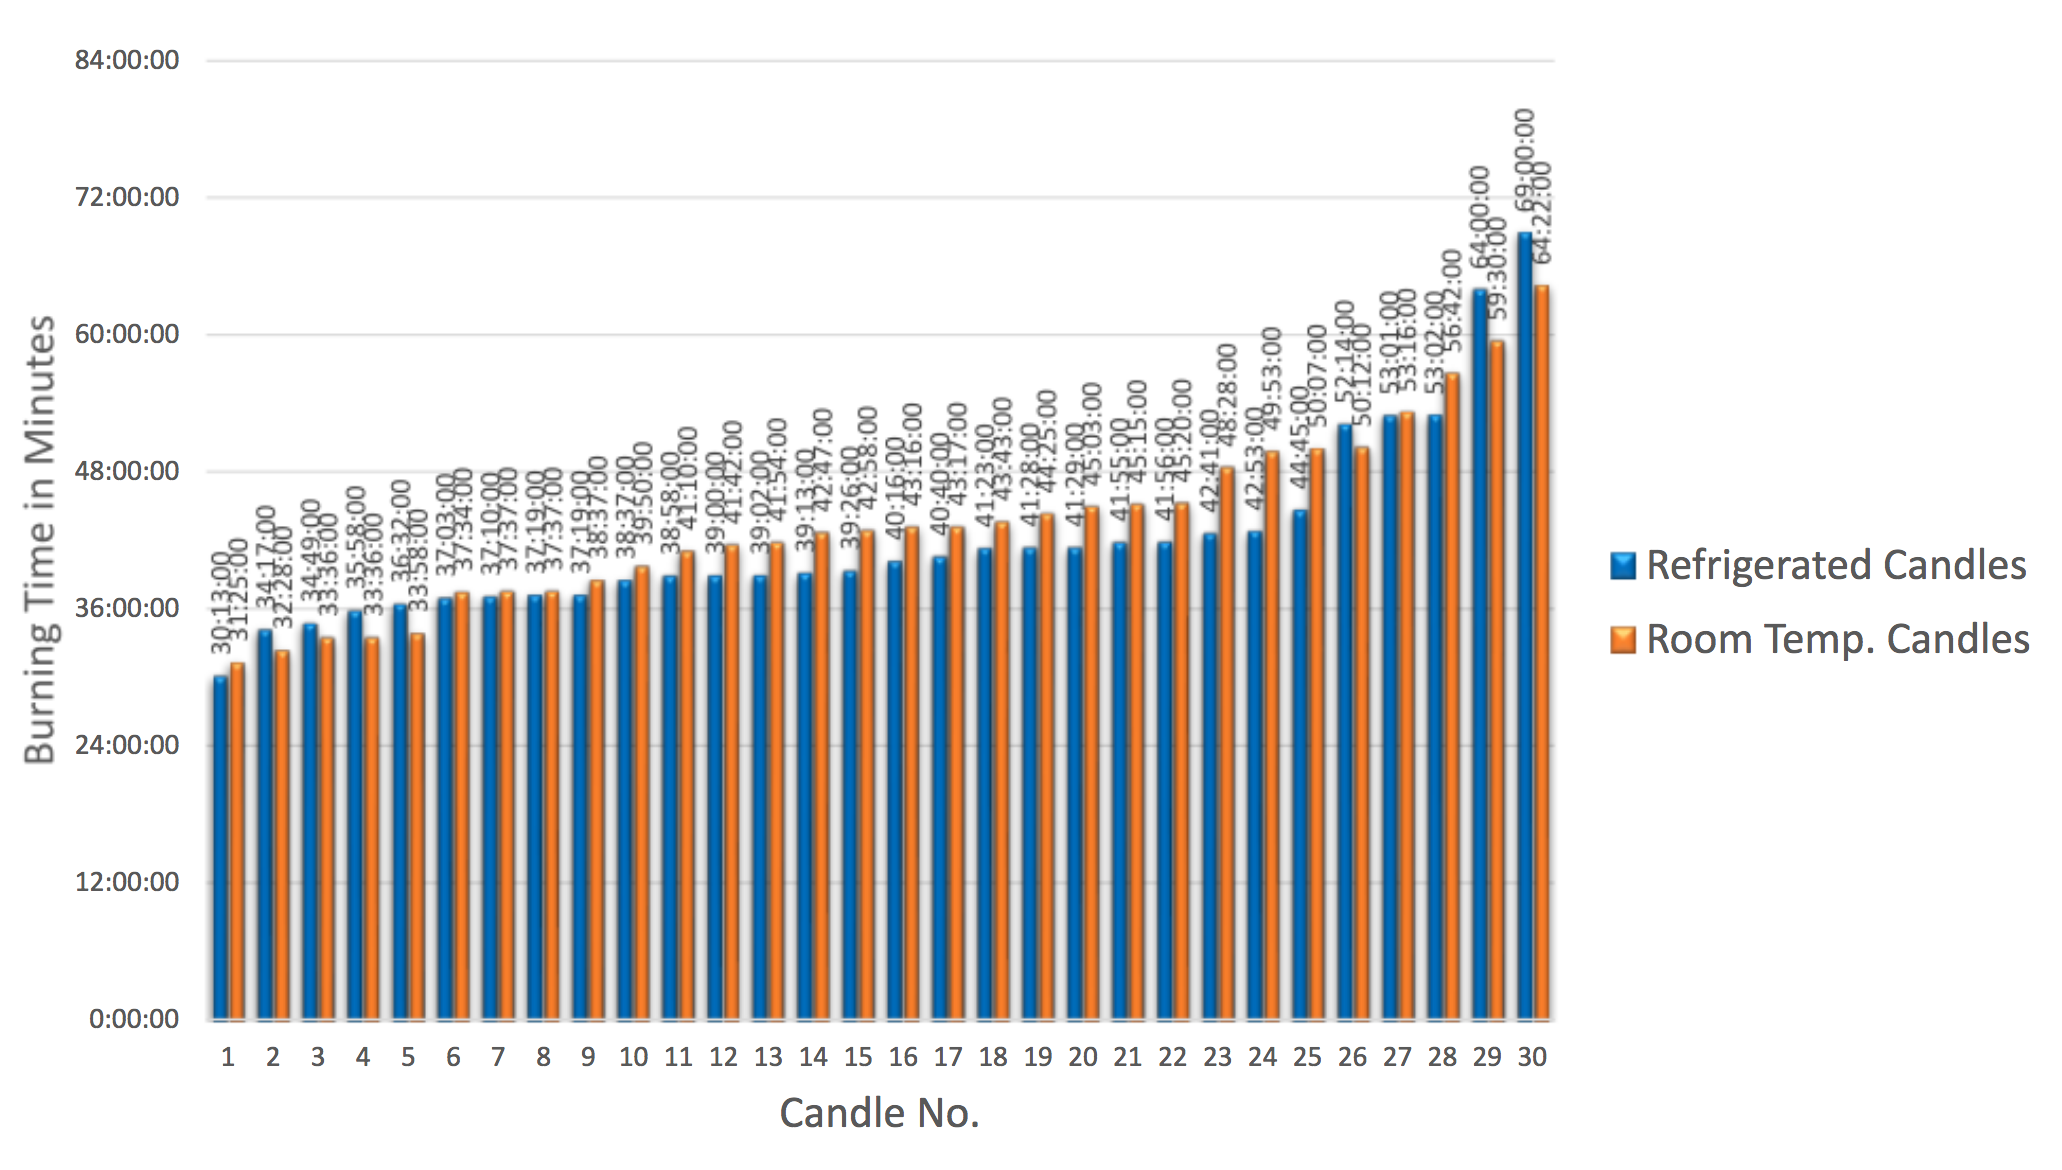
FIGURE 5.6: A graph from a student Project.
- Critique the graph in Fig. 5.7, a screenshot from a student Project Report comparing the 'mean dissolve' time (they probably meant 'mean dissolving time') of Panadol in room temperature and cold water. Identify ways to improve the graph.
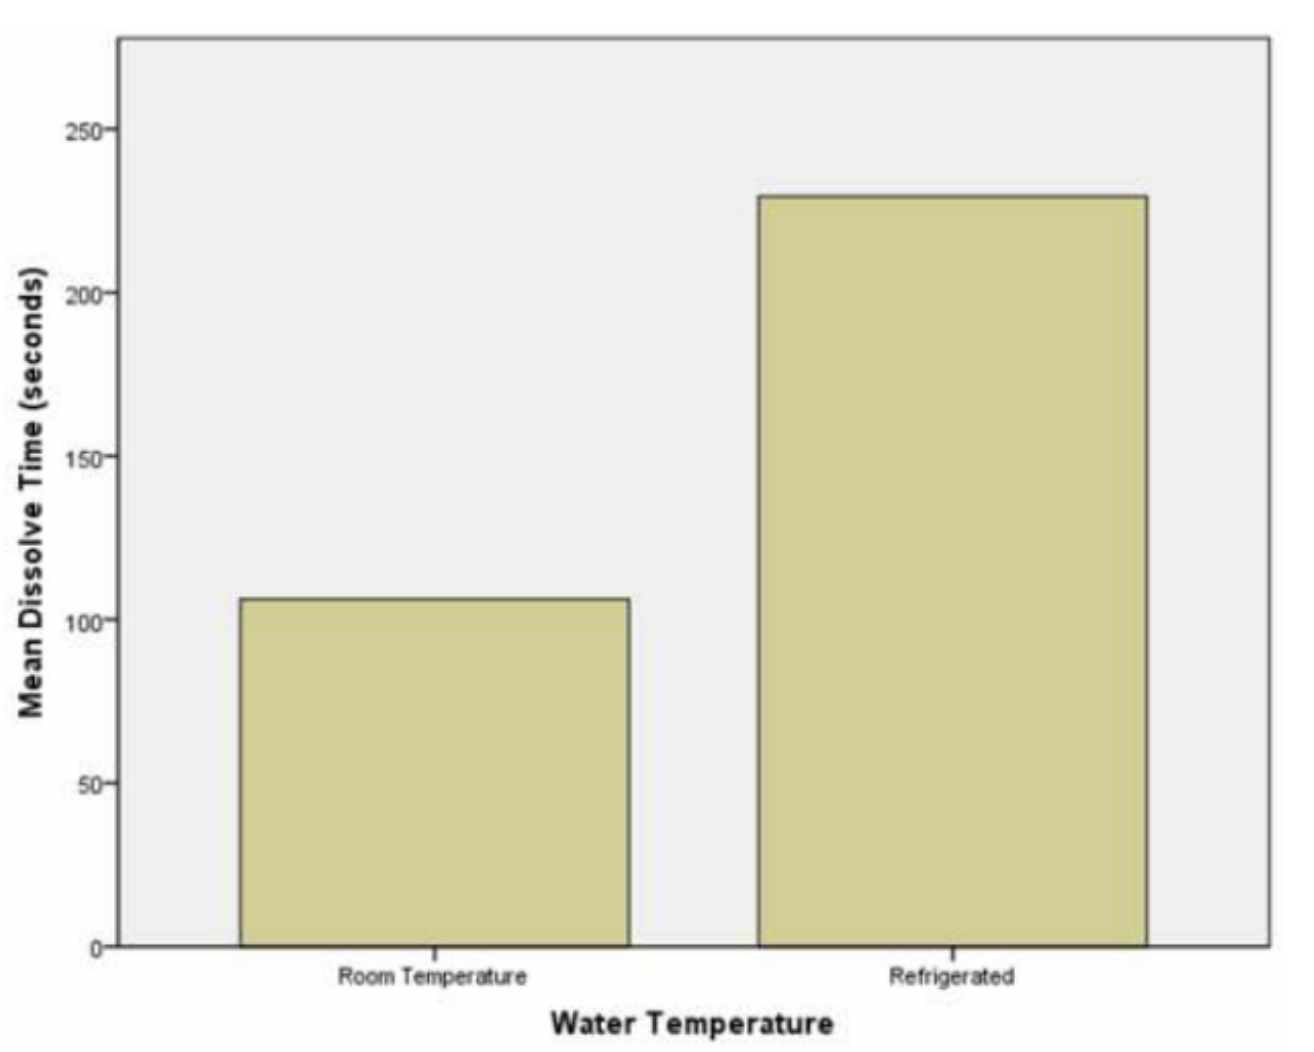
FIGURE 5.7: A graph from a student Project.