8.4 Tests for one mean

In 2011, Eagle Boys Pizza ran a campaign that claimed that Eagle Boys' pizzas were 'Real size \(12\)-inch large pizzas' (Dunn 2012). Eagle Boys made the data from the campaign publicly available.
A summary of the diameters of a sample of \(125\) of their large pizzas is shown in Fig. 8.1. We would like to test the company's claim, and ask the RQ:
For Eagle Boys' pizzas, is mean diameter actually \(12\) inches, or not?
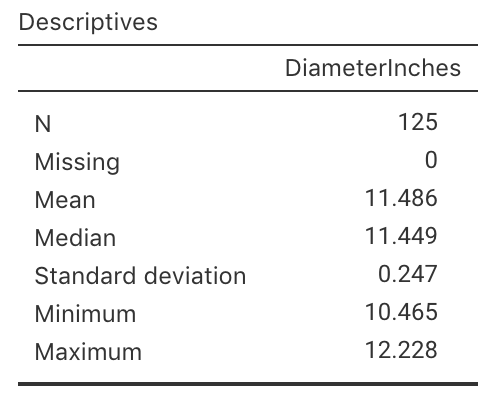
FIGURE 8.1: Summary statistics for the diameter of Eagle Boys' large pizzas; jamovi.
- What is the parameter of interest?
- Write down the values of \(\bar{x}\) and \(s\).
- Determine the value of the standard error of the mean.
- Explain the difference in meaning between \(s\) and \(\text{s.e.}(\bar{x})\) in this context.
- Write the hypotheses to test if the mean pizza diameter is \(12\) inches.
- Is the alternative hypothesis one- or two-tailed? Why?
- Draw the normal distribution that shows how the sample mean pizza diameter would vary by chance, even if the population mean diameter was \(12\) inches.
- Compute the \(t\)-score for testing the hypotheses.
- What is the approximate \(P\)-value using the \(68\)--\(95\)--\(99.7\) rule?
- Write a conclusion. (The CI was found in the Teaching Week 7 tutorial.)
- Is it reasonable to assume the statistical validity conditions are satisfied? How does Fig. 8.2 help, if at all?
- Do you think that the pizzas do have a mean diameter of \(12\) inches in the population, as Eagle Boys' claim? Explain.
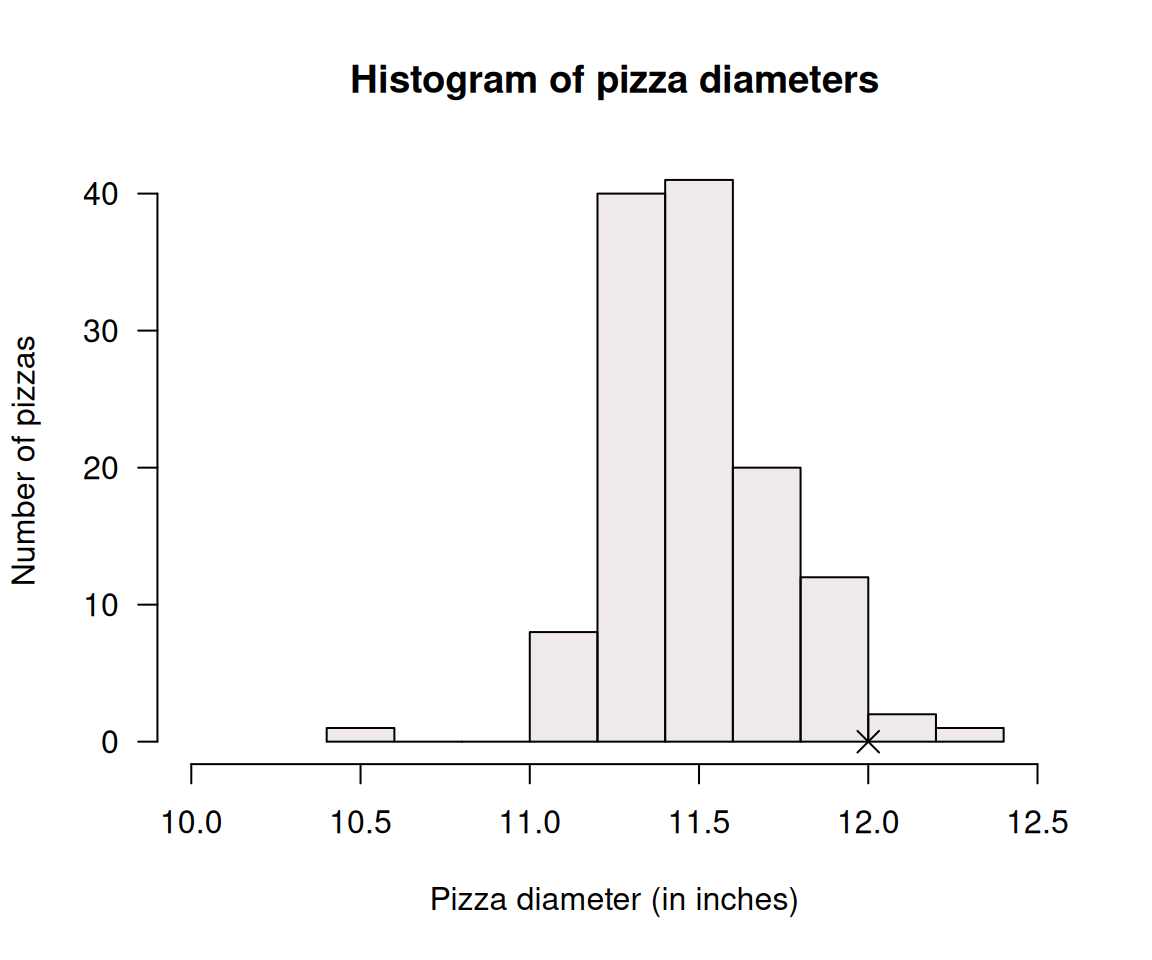
FIGURE 8.2: Histogram for the diameter of Eagle Boys' large pizzas. The cross represents the claimed diameter of \(12\) inches.
References
Dunn PK. Assessing claims made by a pizza chain. Journal of Statistical Education [Internet]. 2012;20(1). Available from: https://www.tandfonline.com/doi/abs/10.1080/10691898.2012.11889637.