10.2 Tests for two means

(This continues from Sect. 8.3.)
Researchers were interested in the impact of diet on the lifetime of rats:
For rats, is the mean lifetime shorter for rats on a free-choice diet compared to rats on a healthy, restricted diet?
A study (Berger et al. 1988) compared the total lifetime of rats on restricted (\(n = 106\) rats) free-eating diets (\(n = 89\) rats).
- Explain why these are two independent samples, and not paired.
- Write down the hypotheses being tested. Is this a one- or a two-tailed test? Explain.
- Explain what the 'standard error of the difference' would mean here.
- What does the error bar chart in Fig. 10.1 tell us?
- What are two possible reasons why the sample mean lifetimes of rats on the two diets are different?
- Write down the \(t\)-score and the appropriate \(P\)-value, using the output in Fig. 10.2 (jamovi) or Fig. 10.3 (SPSS).
- Calculate the \(t\)-score (using the standard error as given in the output), and show it is the same value as given in the output.
- How are the differences defined? What do these mean?
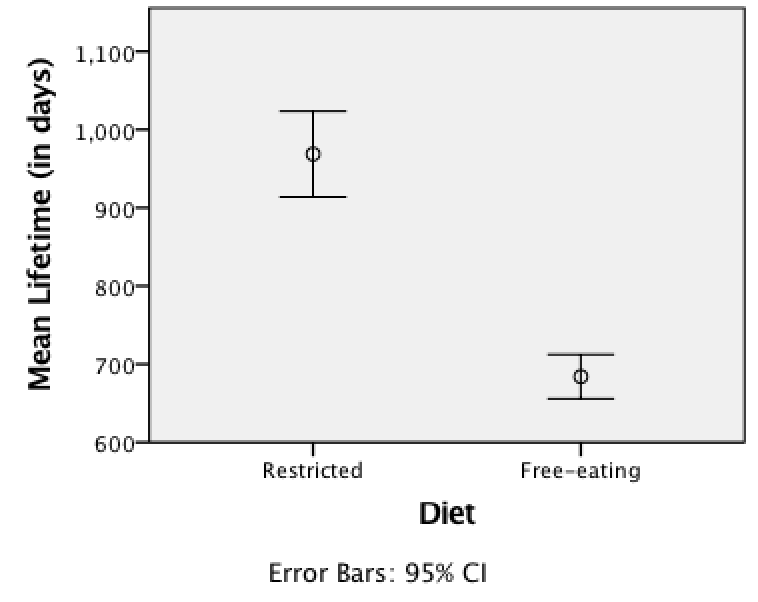
FIGURE 10.1: Error bar chart for the rat lifetime example
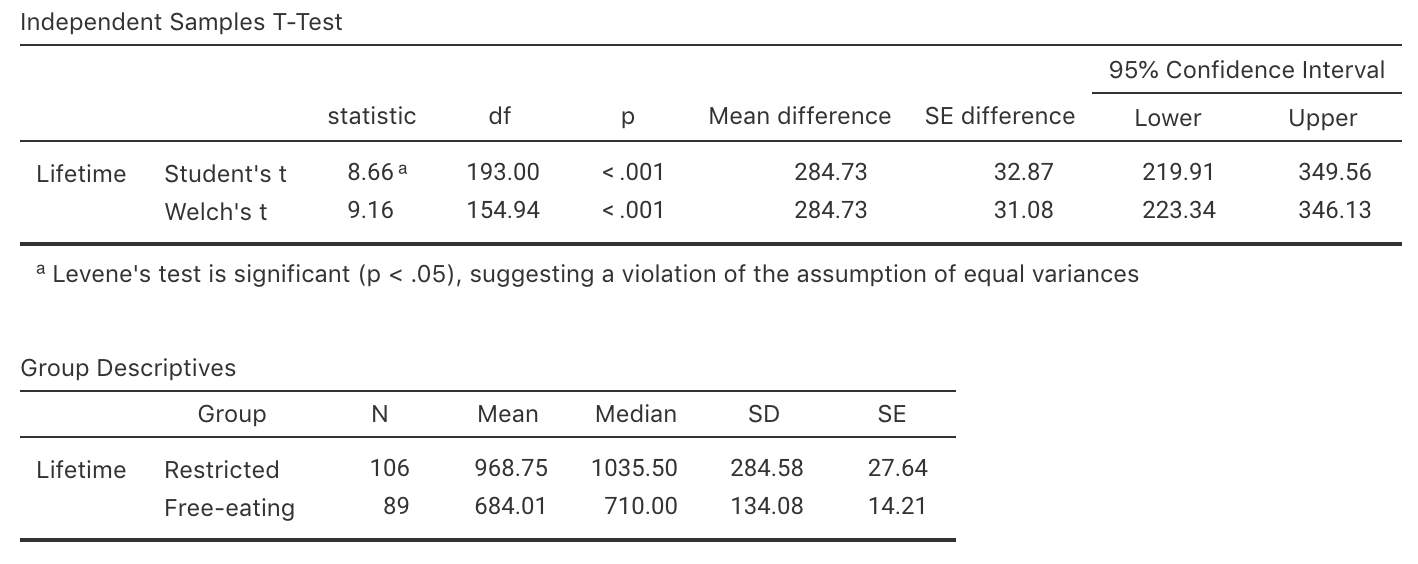
FIGURE 10.2: The jamovi output summarising the rat lifetimes data
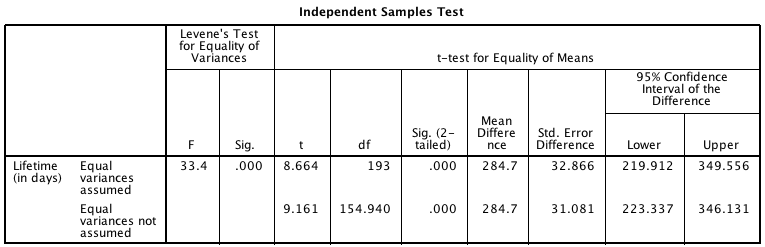
FIGURE 10.3: The SPSS output summarising the rat lifetimes data
- Make a conclusion, in context.
- What conditions are necessary for the test to be statistically valid?
- Is it reasonable to assume these conditions are satisfied?
(You may, or may not, need to refer to Fig. 8.5.) - What if all these rats only came from only \(20\) litters?
References
Berger RL, Boos DD, Guess FM. Tests and confidence sets for comparing two mean residual life functions. Biometrics. 1988;44(1):103–15.