5.8 Identifying appropriate graphs
In each of the following cases:
- Identify the variables;
- Identify what type of variables these are; and
- Hence determine and justify the most appropriate graph for displaying the relationship of interest.
In addition, draw a rough example of what the graph may look like.
Meadowfoam is a plant from which oil can be extracted from its flowers, so maximising flowering is important.
A study (Seddigh and Joliff 1994) examined many individual meadowfoam plants and explored the relationship between the number of flowers each plant produced, and the number of hours of light each plant received.
Early in the \(21\)st century, moves were made to ban smoking in outdoor areas of restaurants, cafes, pubs and bars. However, some people thought this was unnecessary, as they believed that exposure to second-hand smoke was minimal.
To study this phenomenon and to inform public policy, a New Zealand observational study (Stafford et al. 2010) examined numerous al fresco (open air) restaurants.
They collected two pieces of information from each individual restaurant: the number of smokers present at the restaurant at the time of observation (restaurants with no smokers; restaurants with one smoker; restaurants with two or more smokers), and the concentrations of fine particulate matter (PM) measured in the restaurant air at the same time. The researchers wish to compare the PM concentrations across the three groups.
To understand the usage of hospital emergency departments (EDs) in Ireland, a study (Curran et al. 2011) examined many individual admissions.
For each admission to the ED, they recorded if the waiting time was short (within \(3\) hours) or long (\(3\) hours or longer), and the time of day of the admission (in three divisions: \(9\)am to \(5\)pm; \(5\)pm to midnight; and midnight to \(9\)am).
Stress in children is not as well understood as stress in adults.
To examine the issue, a study (Saunders et al. 1999) studied many children, and for each child they determined each child's level of playfulness (measured using a quantitative scale called the Test of Playfulness) and each child's level of 'coping' (measured using a quantitative scale called the Coping Inventory).
5.8.2 Optional: Evaluating graphics
A study of the impact of ants on plant communities (Sankovitz et al. 2018) produced the boxplot in Fig. 5.10, showing the percentage of land covered by plants next to the ant nest, uphill from the ant nest, and downhill from the ant nest.
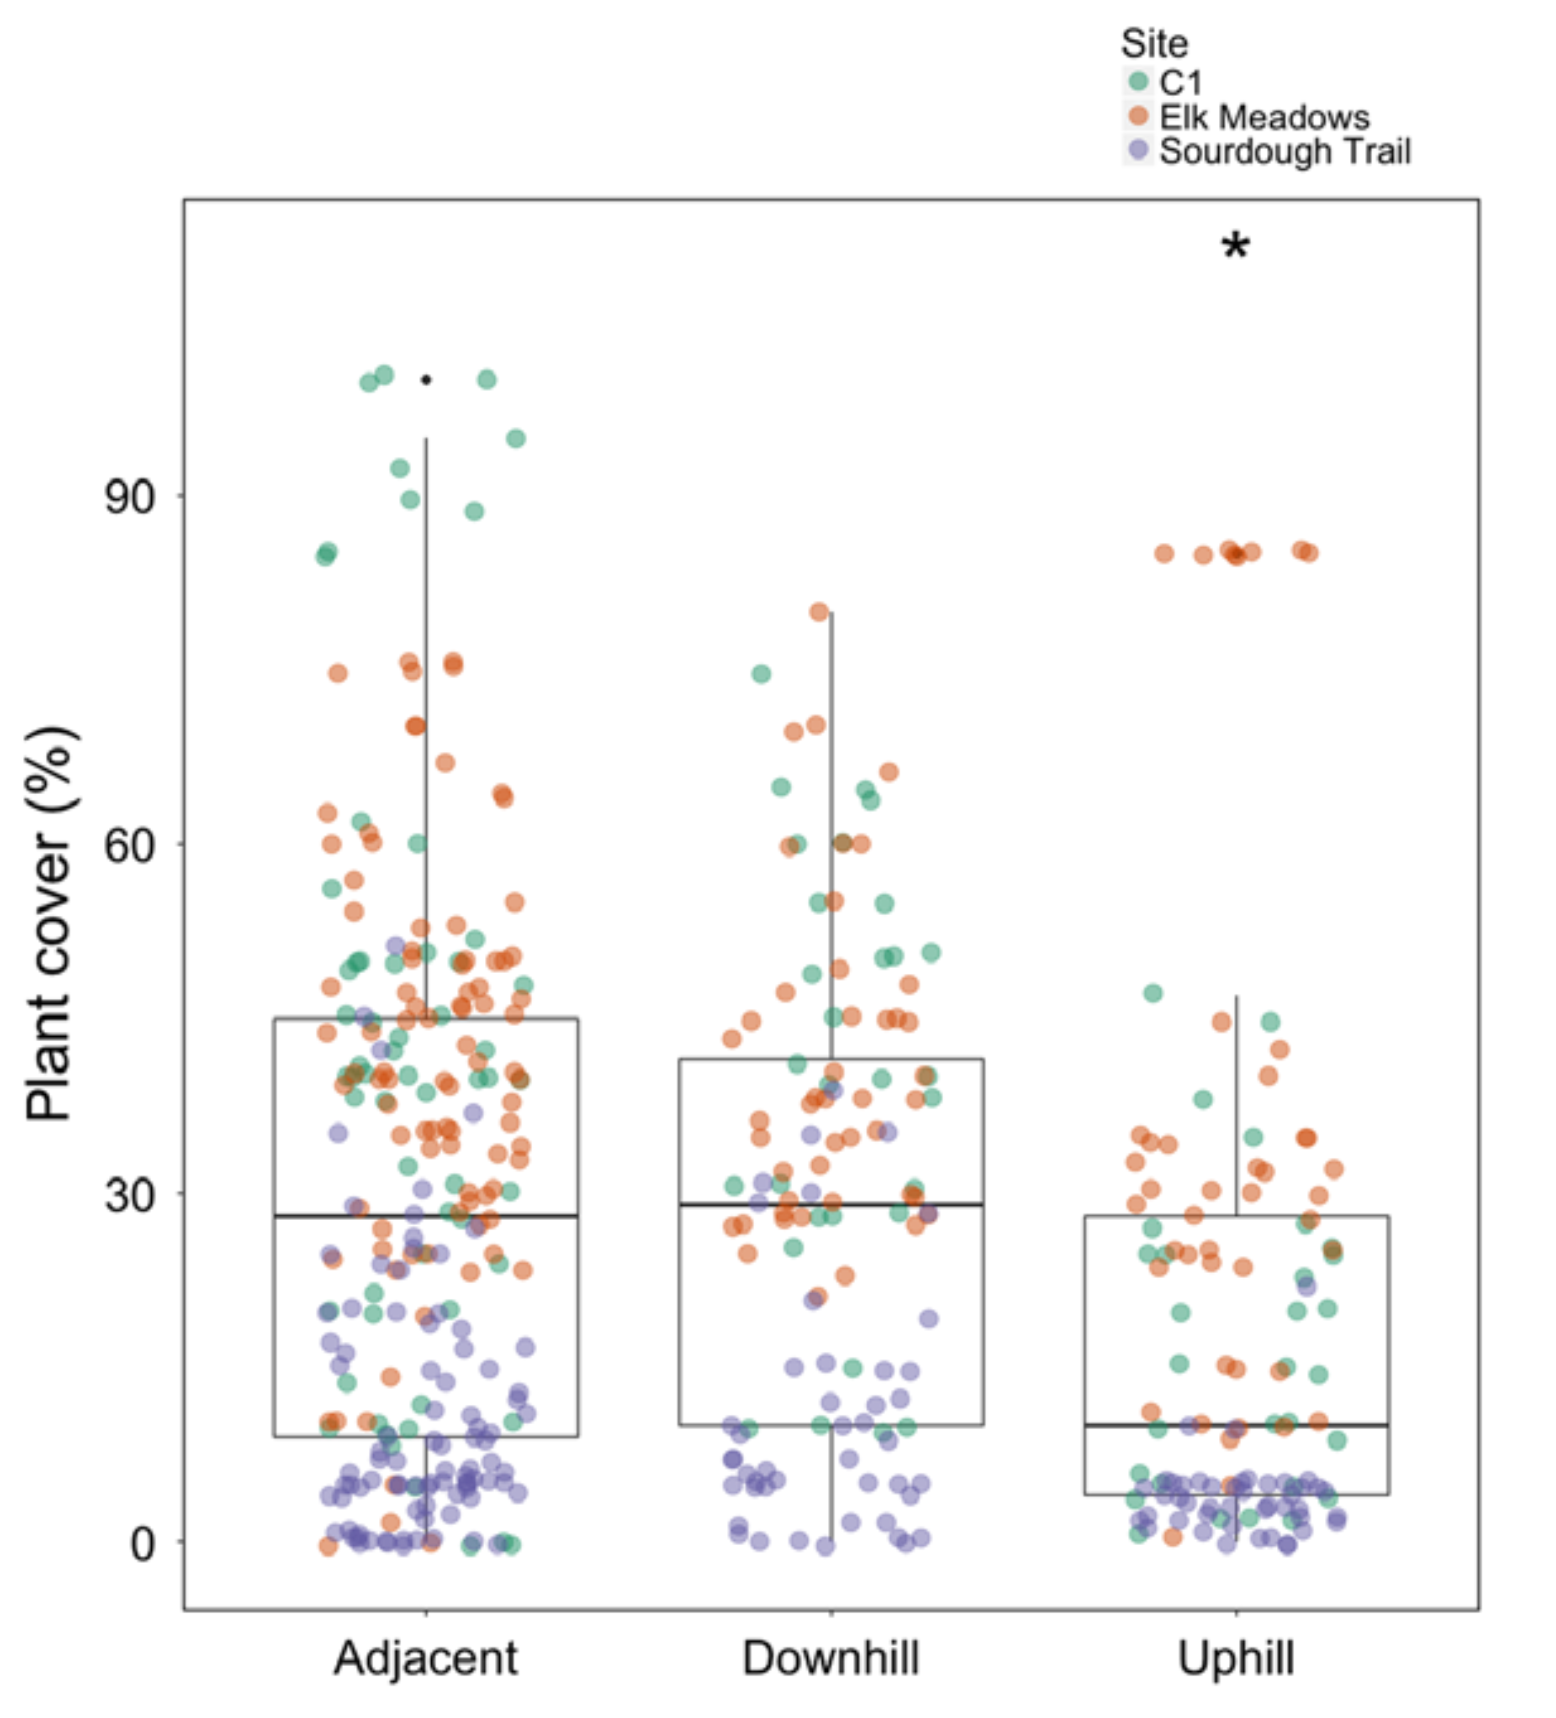
FIGURE 5.10: A graphic from Sankovitz et al. (2018
- Identify the type of study: experimental or observational.
- Identify the units of observation, and the units of analysis.
- Critique this graph.
- Do you think that a real difference exists between median plant coverage at different locations around the ant nest? What other interesting features can be seen from the graph?
5.8.3 Optional: Evaluating graphics
An Australian study (Jennings et al. 2012) studied patients in severe pain and compared two different treatments to determine which to recommend.
Patients were randomly allocated to receive one of two pain treatments: either morphine, or morphine and ketamine.
The pain reduction for each patient was then measured (using the 'pain verbal numeric rating scale': \(0\) is no pain, and \(10\) the worst pain imaginable, such as Australia losing the Ashes), by taking pain measurements before and after giving the treatment.
The graph in Fig. 5.11 summarises the data.
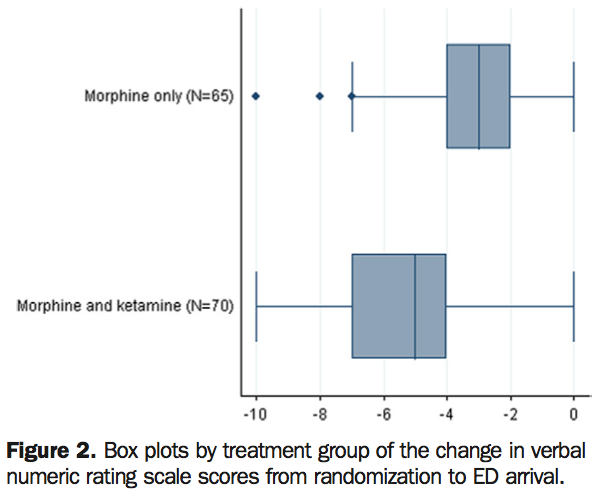
FIGURE 5.11: A graphic from Jennings et al. (2002). 'ED' means 'Emergency Department
- Identify the type of study: experimental or observational.
- Identify the units of observation, and the units of analysis.
- Critique this graph.
- What do you think the negative numbers on the graph mean?
- Do you think that a real difference exists between the nedian for the two treatments in the population? Explain