8.8 Optional: Odds and odds ratio
This question is optional; e.g., if you need more practice, or you are studying for the exam.
(Answers are available in Sect. A.9)
This question has a video solution in the online book, so you can hear and see the solution.
The use of genetically modified (GM) foods is controversial. An Australian study (Luo et al. 2004) decided to study:
...whether income level and attitude to genetic engineering of food are dependent.
To answer this relational RQ, the researcher asked 894 Australians about their income (low or high), and their attitude to GM foods (for or against).
- The data collected are given in Table 8.3. Compute the odds that, among high-income earners, someone is in favour of GM foods.
- Compute the odds that, among low-income earners, someone is in favour of GM foods.
Interpret what this means. - The odds of a high-income earner being in favour of GM foods is how many times more than a low-income earner being in favour of GM food? This value is called the odds ratio.
- For these data, the output is shown in Fig. 8.12 (from jamovi). Write down the confidence interval for the odds ratio, and interpret what this means.
- A politician stated that 'any attempt to suggest that the acceptance of GM foods is related to income are clearly bogus'. Do you agree or disagree?
| High income | Low income | |
|---|---|---|
| For GM foods | 263 | 258 |
| Against GM foods | 151 | 222 |
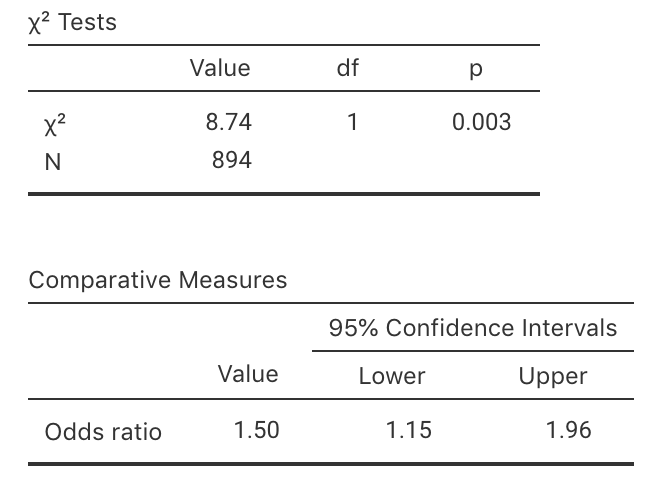
FIGURE 8.12: jamovi output for the GM foods data
References
Luo D, Wood GR, Jones G. Visualising contingency table data. The Australian Mathematical Society Gazette. 2004;31(4):258–62.