8.7 Optional: CI for differences between means
This question is optional; e.g., if you need more practice, or you are studying for the exam.
(Answers are available in Sect. A.9)
This question has a video solution in the online book, so you can hear and see the solution.
In 2011, Eagle Boy's Pizza ran a campaign (Dunn 2012) that claimed that Eagle Boy's pizzas were larger than Domino's large pizzas. Eagle Boy's made the data behind the campaign publicly available.
Each sample contained similar pizzas types (the three toppings were: supreme, Hawaiian, meat-lovers; the three base types were deep, thin, mid).
Some output from a sample of \(125\) of Eagle Boys' and Domino's large pizzas is shown in Fig.
8.9 (jamovi) and Fig. 8.10 (SPSS).
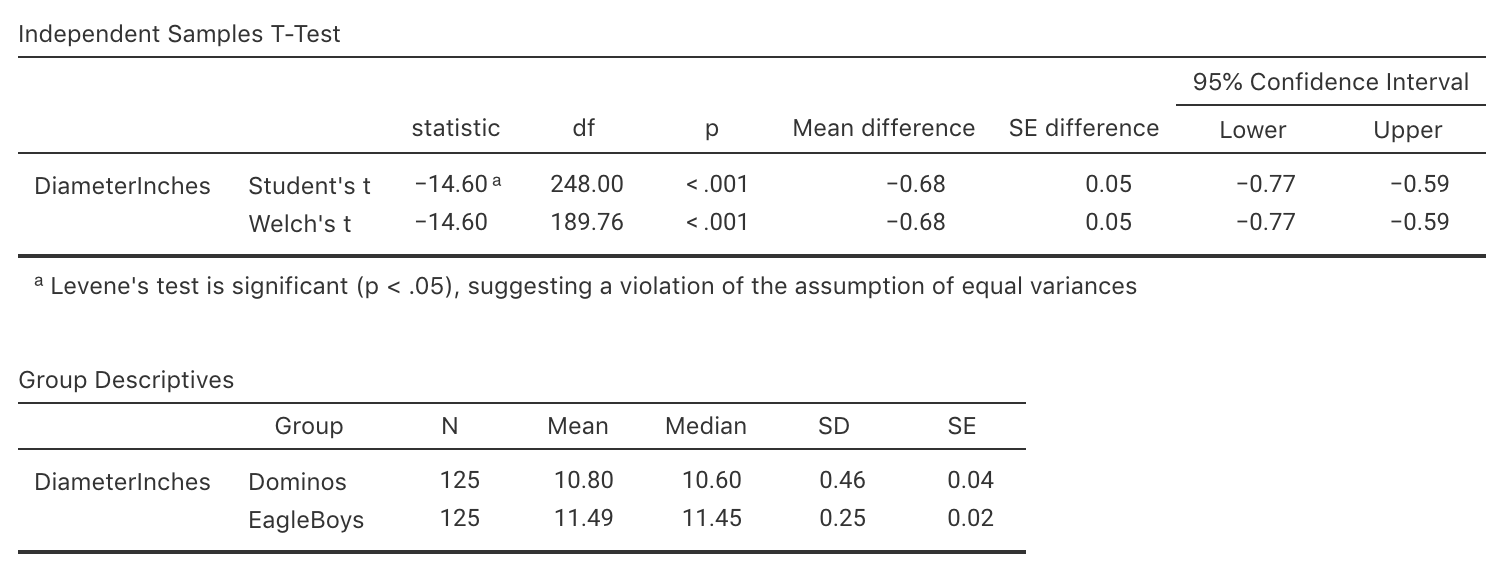
FIGURE 8.9: Summary statistics for the diameter of Eagle Boy's and Domino's large pizzas, from jamovi
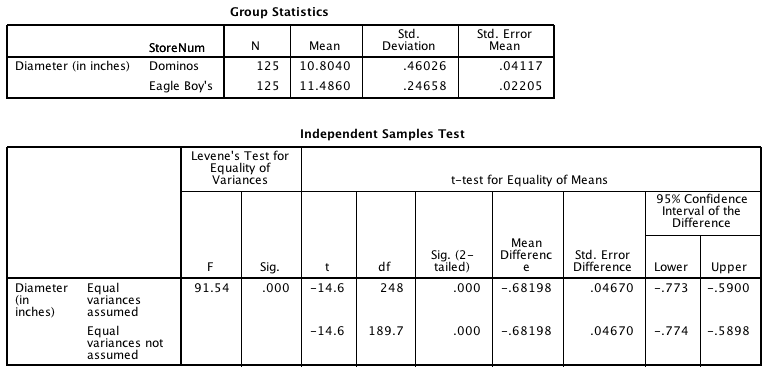
FIGURE 8.10: Summary statistics for the diameter of Eagle Boy's and Domino's large pizzas, from SPSS
Explain whether the study is observational or experimental (true or quasi).
Identify the type of research question is being answered: descriptive, relational, repreated-measures or correlational? Explain.
Two students are arguing about this study. One claims that the study compares two independent samples, because the pizzas have come from two different companies completely. The other student argues that the study has paired samples, because each store has the same types of pizzas in the sample (e.g. both have supreme, Hawaiian and meat-lovers pizzas).
With whom do you agree? Why?
Write down the CI to estimate the difference in population means.
Write a statement communicating the confidence interval.
What does the right panel of Fig. 8.11 communicate?
What condition must hold for the CI to be statistically valid?
Is it reasonable to assume these conditions are satisfied? (You may need to refer Fig. 8.11.)
Eagle Boy's claimed that their pizzas are 'larger' than Domino's pizzas. Do you agree or disagree?
Why? What other information would be helpful for answering this question?
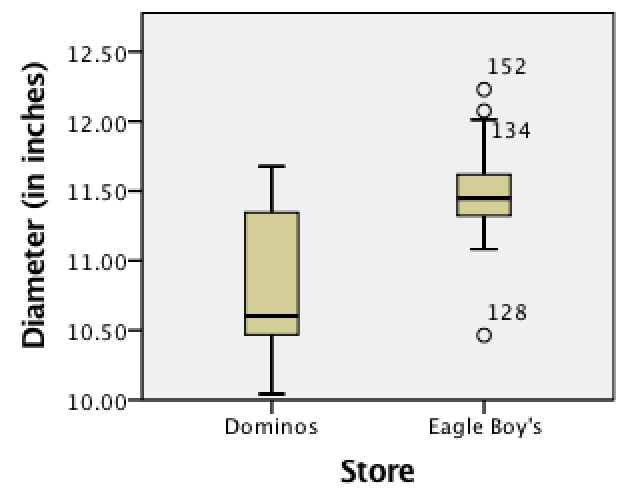

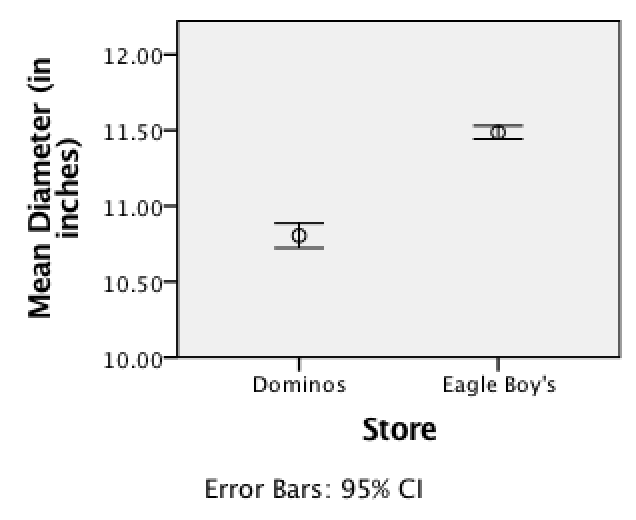
FIGURE 8.11: Boxplot (left panel) and error-bar chart (right panel) for the pizza size data