11.6 Optional: Reading scatterplots
This question is optional; e.g., if you need more practice, or you are studying for the exam.
(Answers are available in Sect. A.11)
This question has a video solution in the online book, so you can hear and see the solution.
Researchers in New Zealand were interested in:
...the behaviour of heather (Calluna vulgaris) in Tongariro National Park...: the potential for herbicidal control; likely changes in secondary vegetation if biological control is effective; some aspects of its demography; and, finally, whether heather acts to facilitate or impede rates of native shrub invasion of red tussock grassland.
--- Rogers (1996)
The graph in Fig. 11.8 comes from this study examining heather in the central North Island of New Zealand.
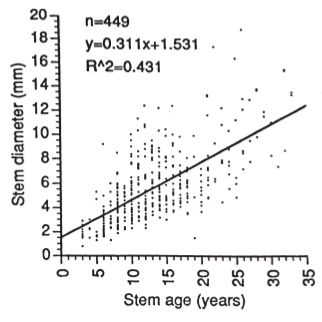
FIGURE 11.8: Figure 2 (top panel) from Rogers (1996)
- Identify a possible research question being answered by the graph.
- Critique the graph
- Compute the value of \(r\), and interpret.
- For a stem age of \(20\) years, what does the regression model predict as the mean stem diameter?
- Interpret the meaning of the slope and intercept in the regression equation. Comment on these interpretations.