5.12 Optional: Evaluating graphics
This question is optional; e.g., if you need more practice, or you are studying for the exam.
(Answers are available in Sect. A.3)
A study of the impact of ants on plant communities (Sankovitz et al. 2018) produced the boxplot in Fig. 5.9, showing the percentage of land covered by plants next to the ant nest, uphill from the ant nest, and downhill from the ant nest.
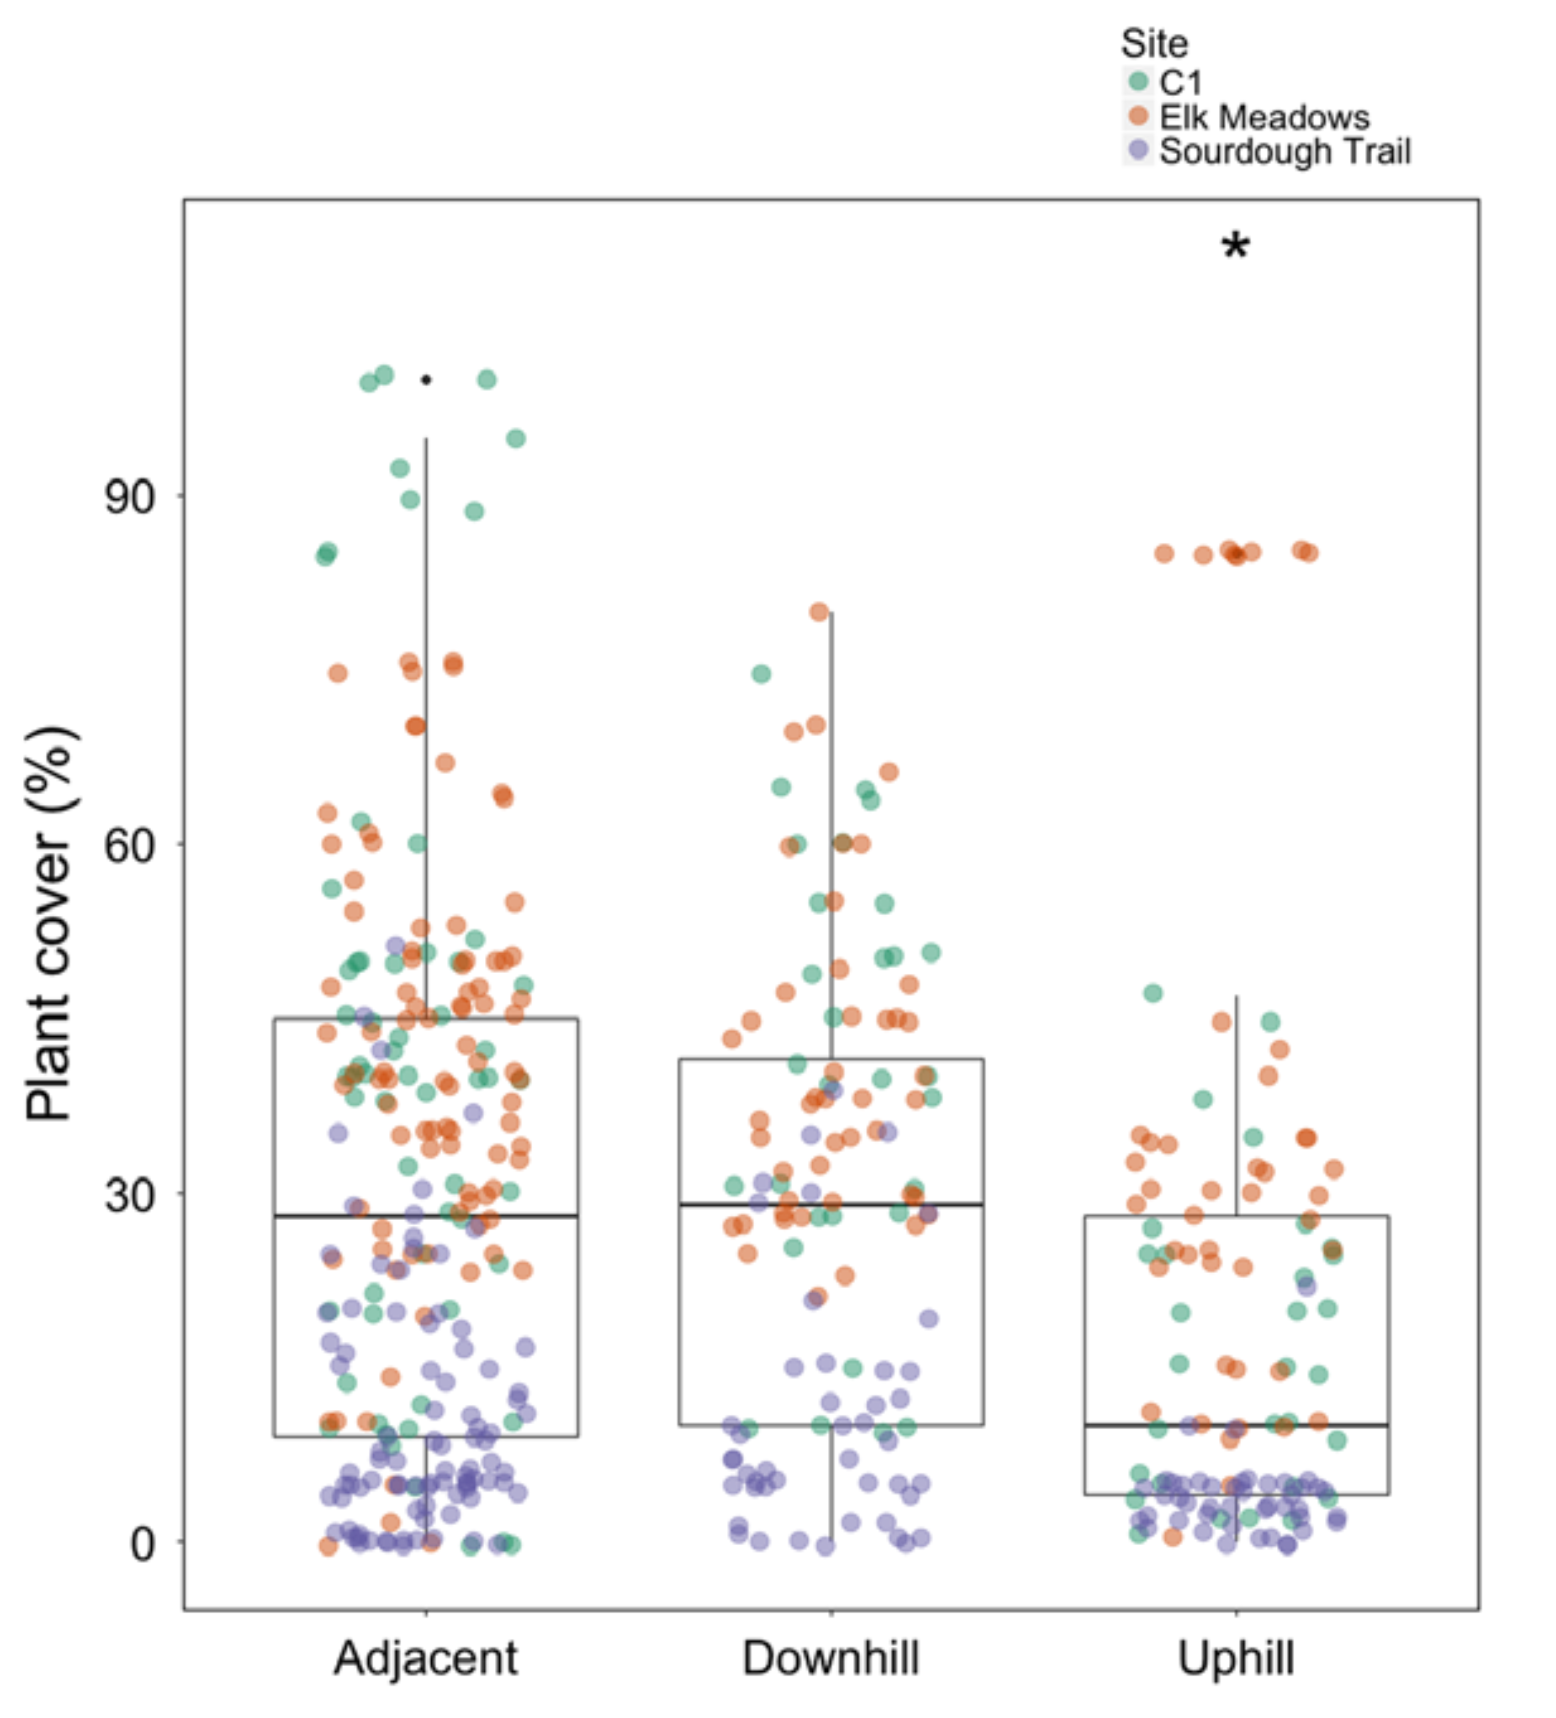
FIGURE 5.9: A graphic from Sankovitz et al. (2018
- Identify the type of study: experimental or observational.
- Identify the units of observation, and the units of analysis.
- Critique this graph.
- Do you think that a real difference exists between median plant coverage at different locations around the ant nest? What other interesting features can be seen from the graph?
References
Sankovitz MA, Breed MD, McCreery HF. Effects of Formica podzolica ant colonies on soil moisture, nitrogen, and plant communities near nests. Ecological Entomolgy. 2018;