D.3 Basic R colors
To gain control over colors, we first need to find or define colors or color palettes. Given a color palette, we need to instruct R to access and use its colors when creating visualizations. The two basic ways of specifying colors in R are by name and by number.
D.3.1 Color names
R comes with 657 predefined colors, whose names can be viewed by evaluating colors() in the console, or running demo("colors"). Figure D.3 shows a random sample of 200 colors (from all 657 colors, but excluding its 224 shades of grey and gray):

Figure D.3: 200 random (non-gray) colors (from colors()) and their names in R.
Figure D.3 shows that there is no shortage of vibrant colors in R.
However, choosing and combining colors from the list of colors() resembles a lottery:
We can get lucky, but in most cases the outcome will be disappointing.
A more promising approach is using functions that generate color palettes that follow the same principles and thus are more likely to fit together.
D.3.2 Color numbers
Many R plotting functions allow specifying colors by a numeric index (e.g., col = 2), rather than a name.
When choosing colors by number, R internally evaluates the vector of its default color palette palette():
palette()  # show current default colors
#> [1] "black"   "#DF536B" "#61D04F" "#2297E6" "#28E2E5" "#CD0BBC" "#F5C710"
#> [8] "gray62"
For several decades, the default color palette() of R used to be pretty ugly (see this blog post for a discussion of its deficits):
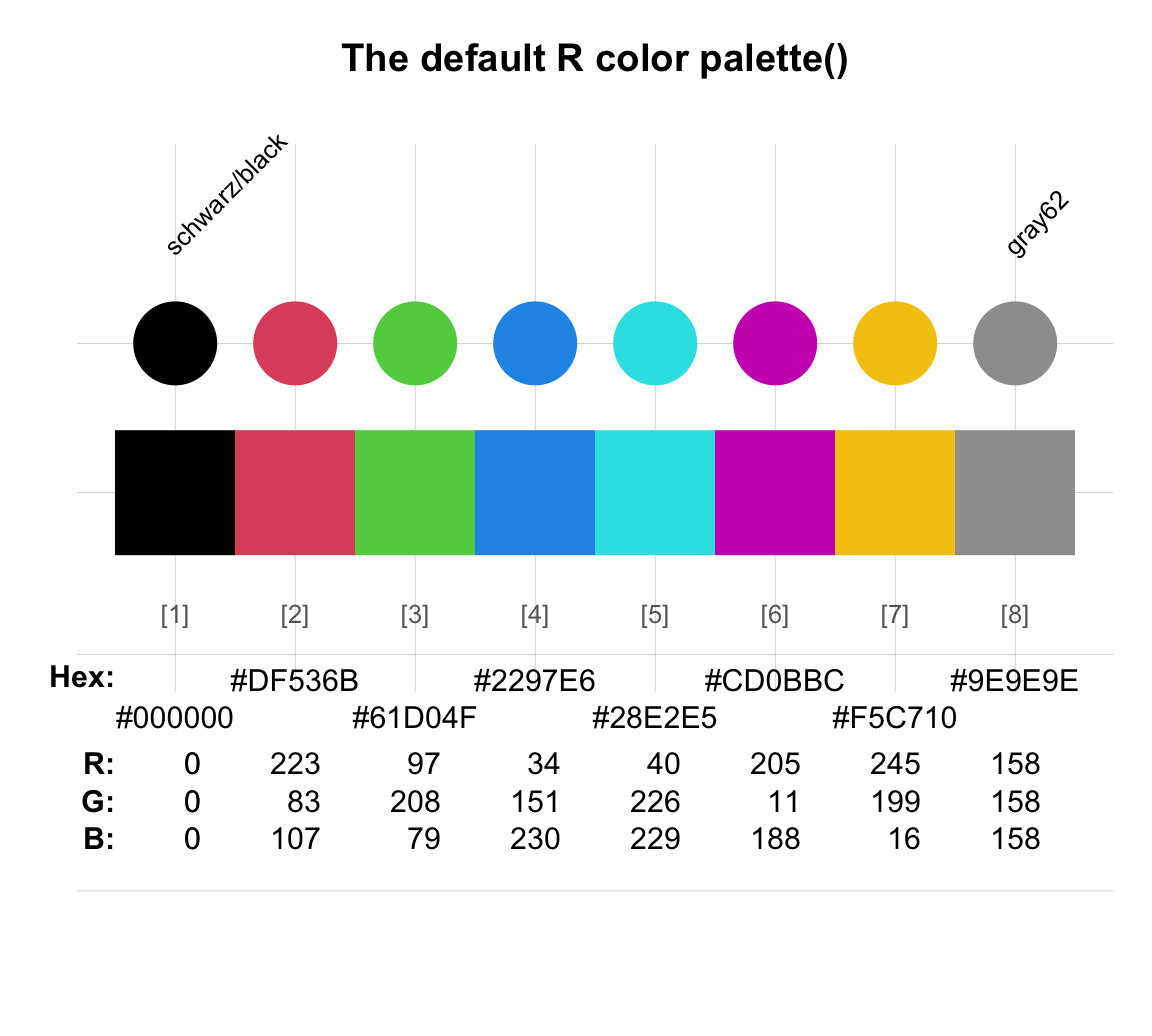
Figure D.4: The default color palette() of R (using R version 4.0.5 (2021-03-31)).
From R version 4.0.0 onwards (released on 2020-04-24), this palette has been replaced by a new palette “R4,” which is no longer quite as horrible. Nevertheless, the really good news is that recent versions of R provide several new predefined palettes. Especially the new palette.colors() function provides a sensible and simple way for generating a set of decent and disinguishable colors for depicting different types of data.
Color alternatives
It is possible to re-define the default palette() to a different color palette (see Section D.3.6 below). But before doing so, it makes sense to explore other options provided by R:
Using base R color functions (Section D.3.3)
Using HCL color palettes (Section D.3.4)
Designing palettes for color vision deficiencies (Section D.3.5)
Changing the default palette (Section D.3.5)
All the options mentioned so far rely on resources that any R system provides by default (in its base, graphics and grDevices packages). If this still does not satisfy your need for colors, your further options include:
Using color packages (Section D.4)
Defining and using custom colors (Section D.5)
D.3.3 Base R color functions
The grDevices package that is included in R comes with a range of functions that allow defining color palettes.
To obtain continuous color palettes, the grDevices package of R traditionally offers several functions to define vectors of n colors:
n <- 10

p1 <- cm.colors(n)
p2 <- rainbow(n)
p3 <- heat.colors(n)
p4 <- terrain.colors(n)
p5 <- topo.colors(n)

# Example plots:
pie(rep(1, n), col = p1, main = "Pie plot with rainbow(n = 10)")
barplot(seq(1:n), col = p4, main = "Bar plot with terrain.colors(n = 10)")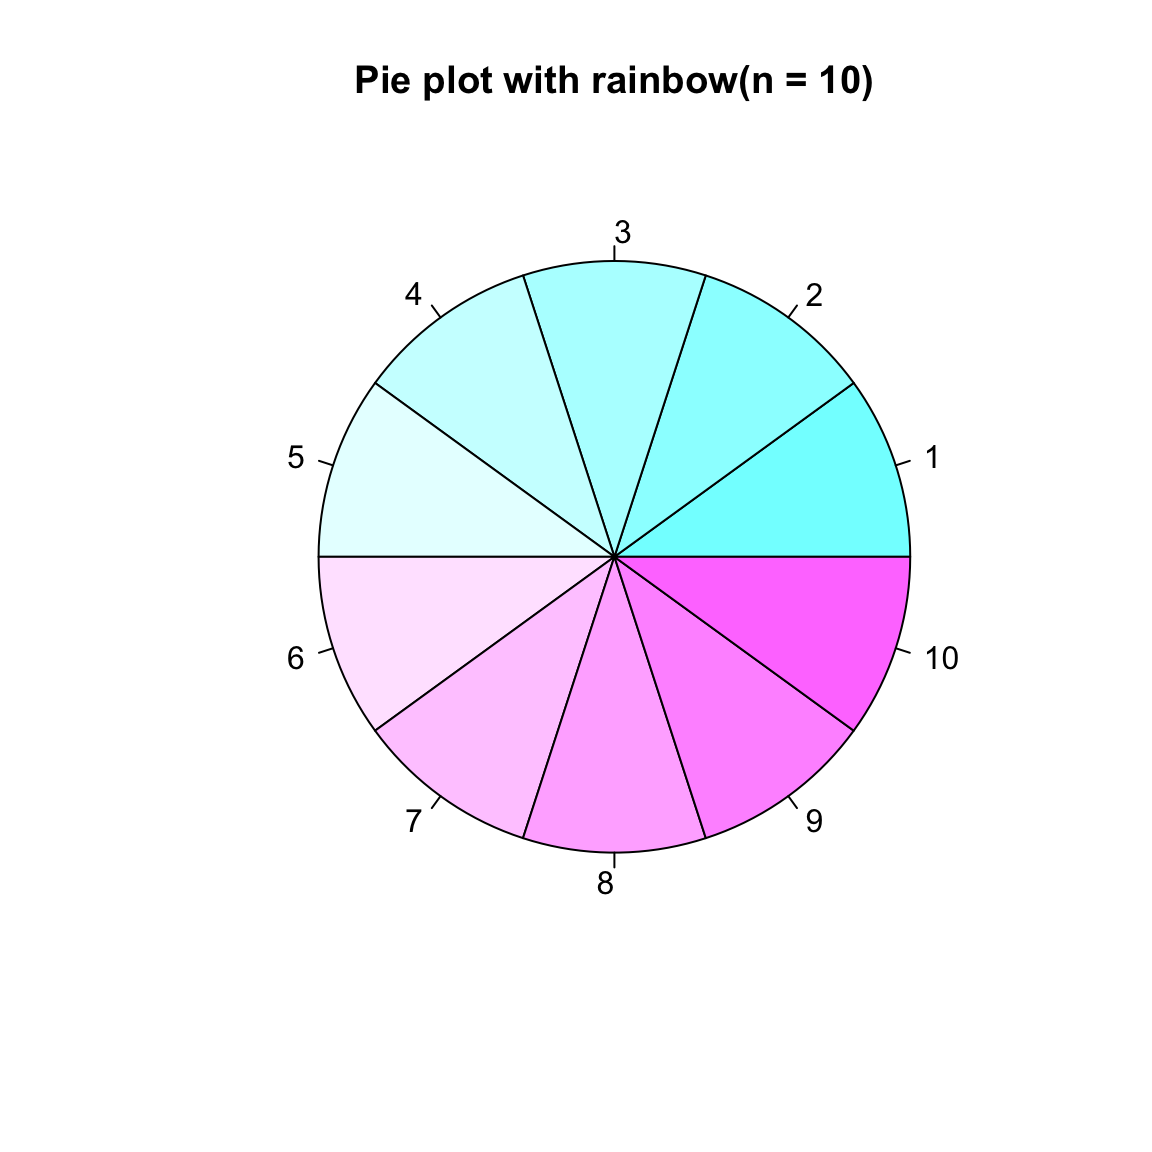
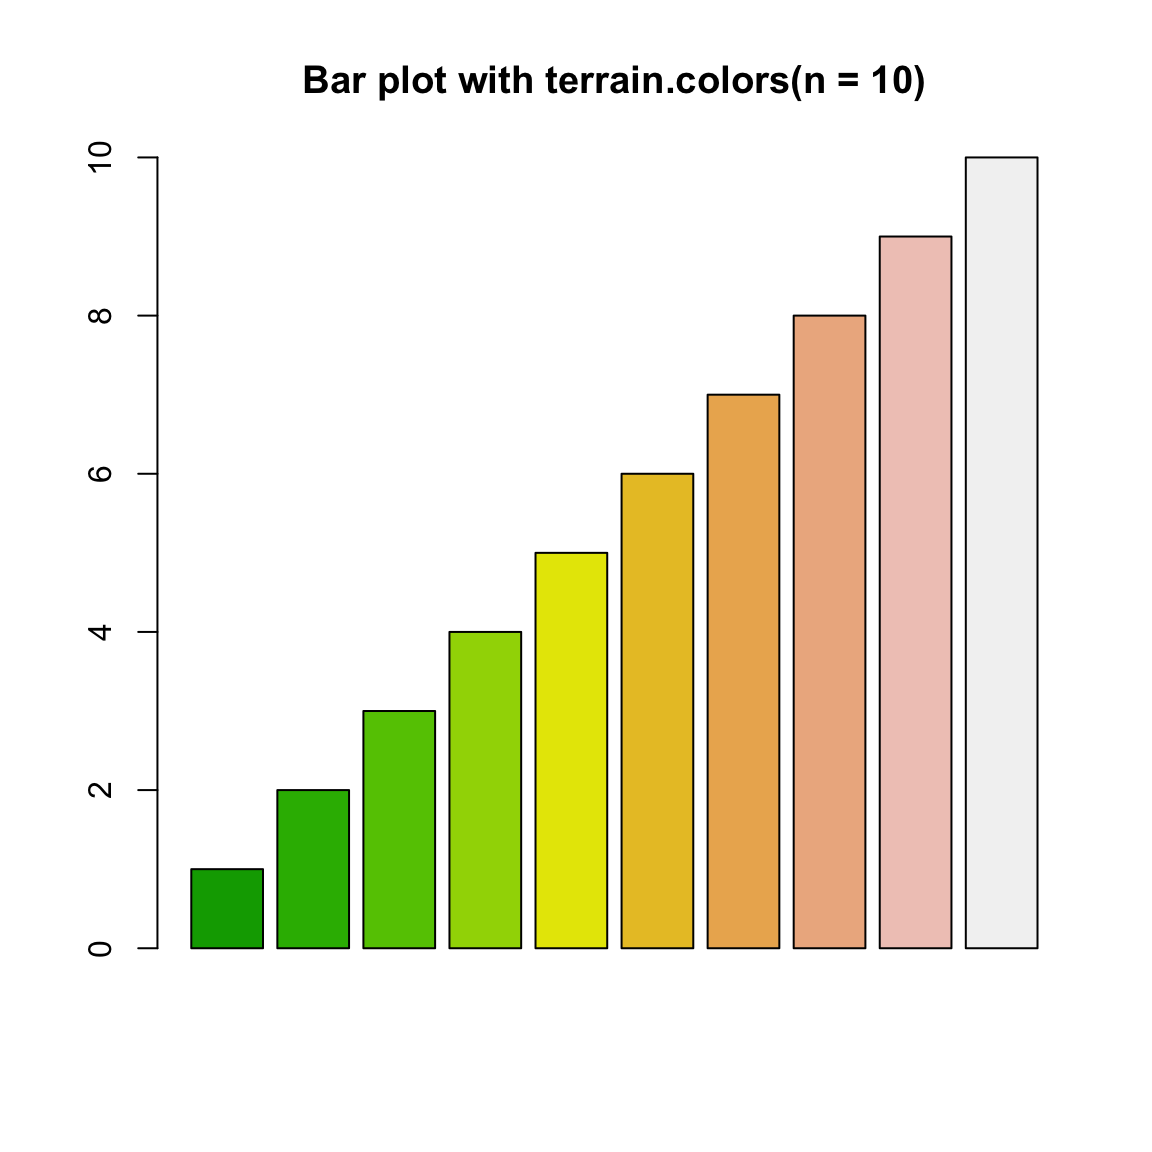
The color palettes returned as the output of these color functions are vibrant and bright:
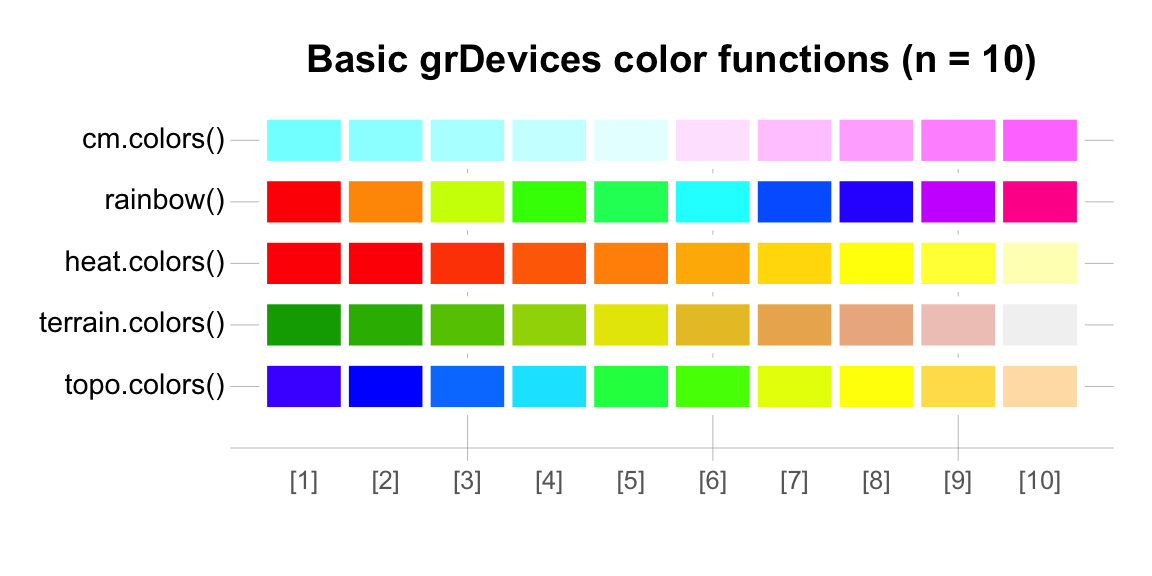
Figure D.5: Example outputs (for n = 10) of color functions grDevices.
However, obtaining truly beautiful color palettes requires more than just automatically drawing colors from some function. The following color palettes have in common that they include an element of design.
D.3.4 HCL color palettes
There are many ways of encoding color.
Besides the named colors, specifying colors in terms of their HEX or RGB values is fairly common in R.
An alternative in R is the HCL color system that specifies a color by its hue (color type), chroma (the color colorfulness), and luminance (color brightness). Starting with R version 3.6.0 (released on 2019-04-26), the hcl.colors() function of the grDevices package provides a basic and frugal implementation of the prespecified palettes in the colorspace package (Ihaka et al., 2020) (see Zeileis et al. (2020) and this blog post for details).
From this version onwards, the default colors for image() and filled.contour() are based on hcl.colors().
In addition, palette-generating functions (like rainbow() and gray.colors()) feature a new rev argument to facilitate reversing the order of colors (which can also be done by using rev() to reverse the output vector of a color function).
Example HCL palettes
Evaluate hcl.pals() to obtain the names of 110 pre-defined HCL palettes.
Here are some examples of palettes included in hcl.colors():
n <- 10

h1 <- hcl.colors(n, palette = "Dynamic")
h2 <- hcl.colors(n, palette = "Earth")
h3 <- hcl.colors(n, palette = "Berlin")
h4 <- hcl.colors(n, palette = "Fall")
h5 <- hcl.colors(n, palette = "Sunset")

library(unikn)
seecol(list(h1, h2, h3, h4, h5),
       col_brd = "white", lwd_brd = 4,
       title = "Example palettes from hcl.colors(n = 10)",
       pal_names = c("Dynamic", "Earth", "Berlin", "Fall",  "Sunset"))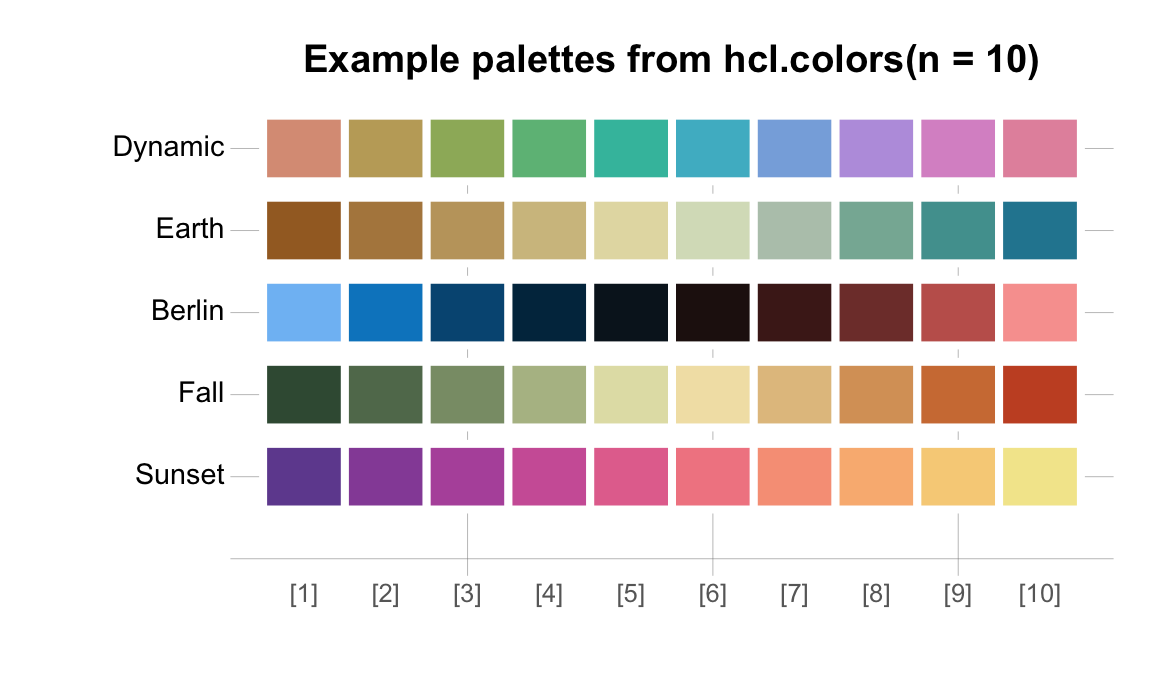
Figure D.6: Example outputs (for n = 10) of named HCL color palettes.
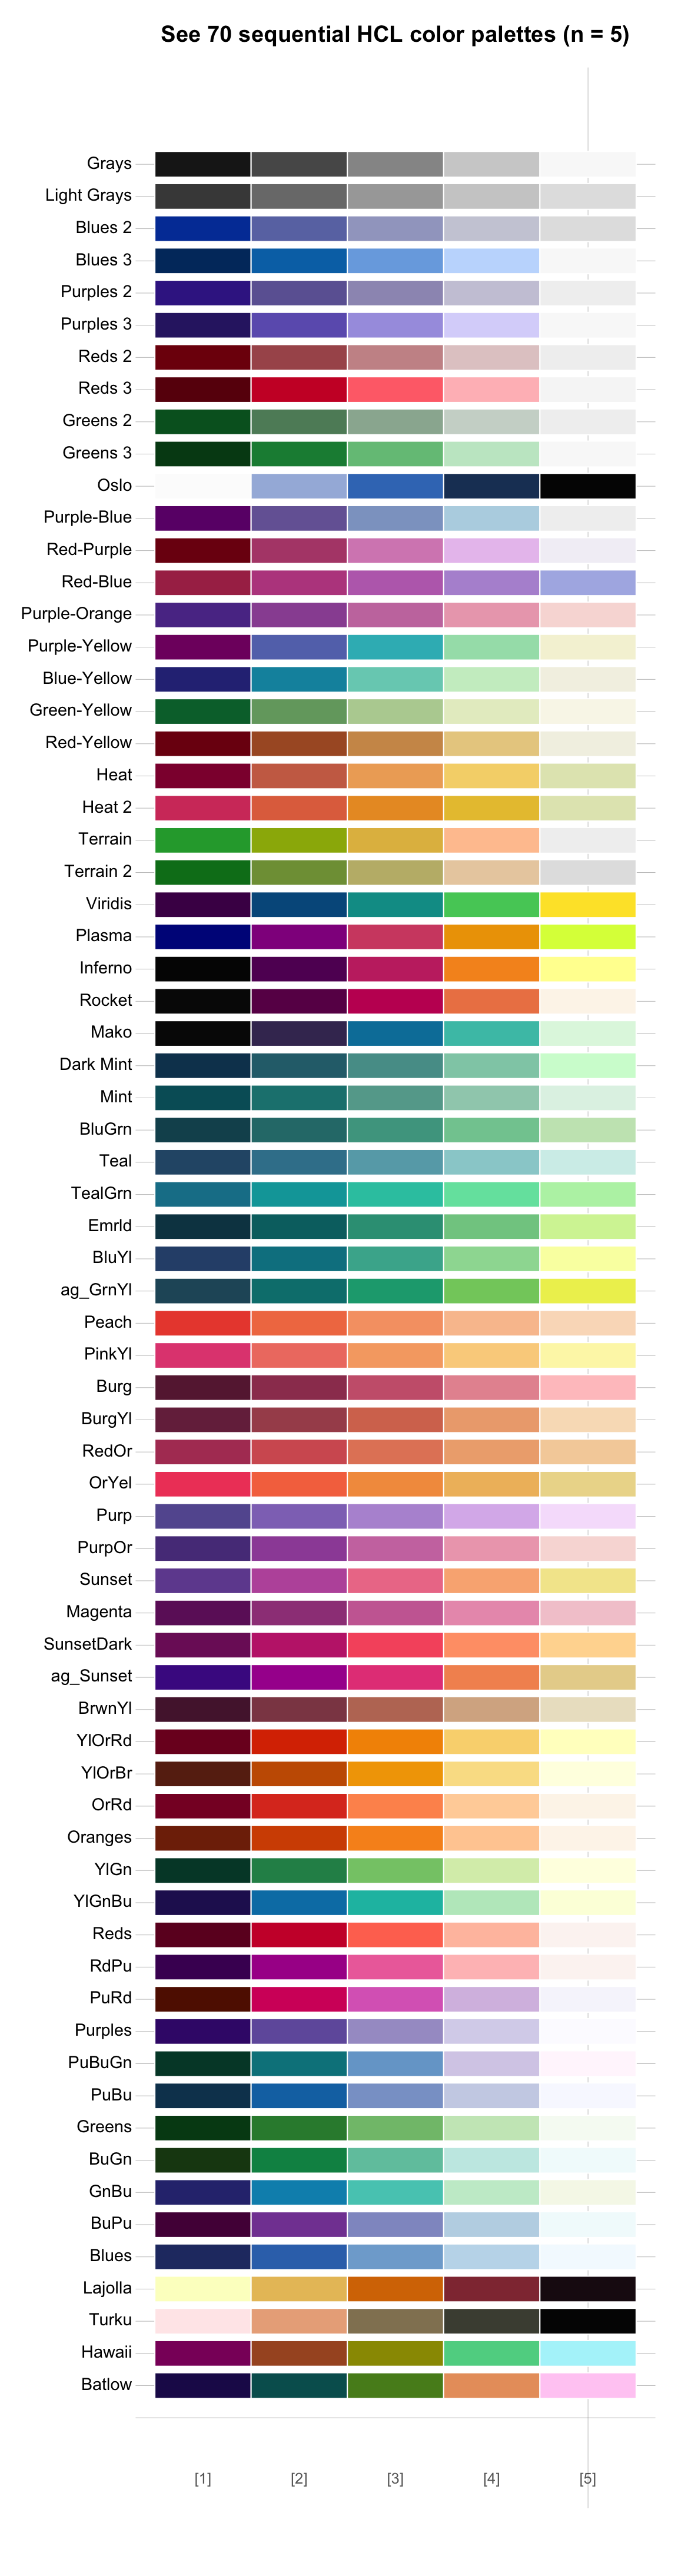
All HCL palettes (by type)
Overall, there are 110 HCL color palettes (in the grDevices of R).
Given this large number of options, seeing them would facilitate choosing a palette — which is why we show them here (using the palette comparison feature of the seecol() function).
When the colorspace package is available, calling hcl_palettes(plot = TRUE) also provides a compact overview of all palettes.
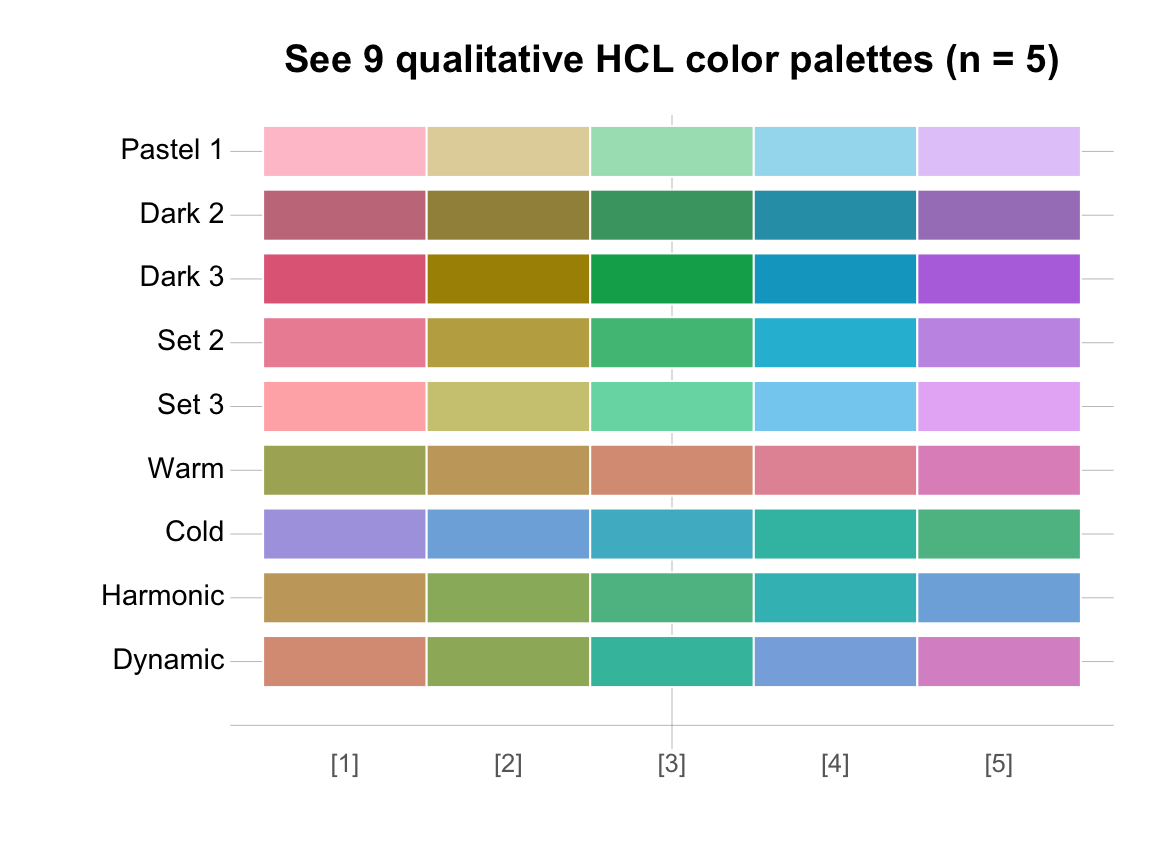
The color palettes of hcl.pals() come in four different types:
- The 9 qualitative HCL color palettes exhibit a characteristic Pastel look and all look fairly similar:
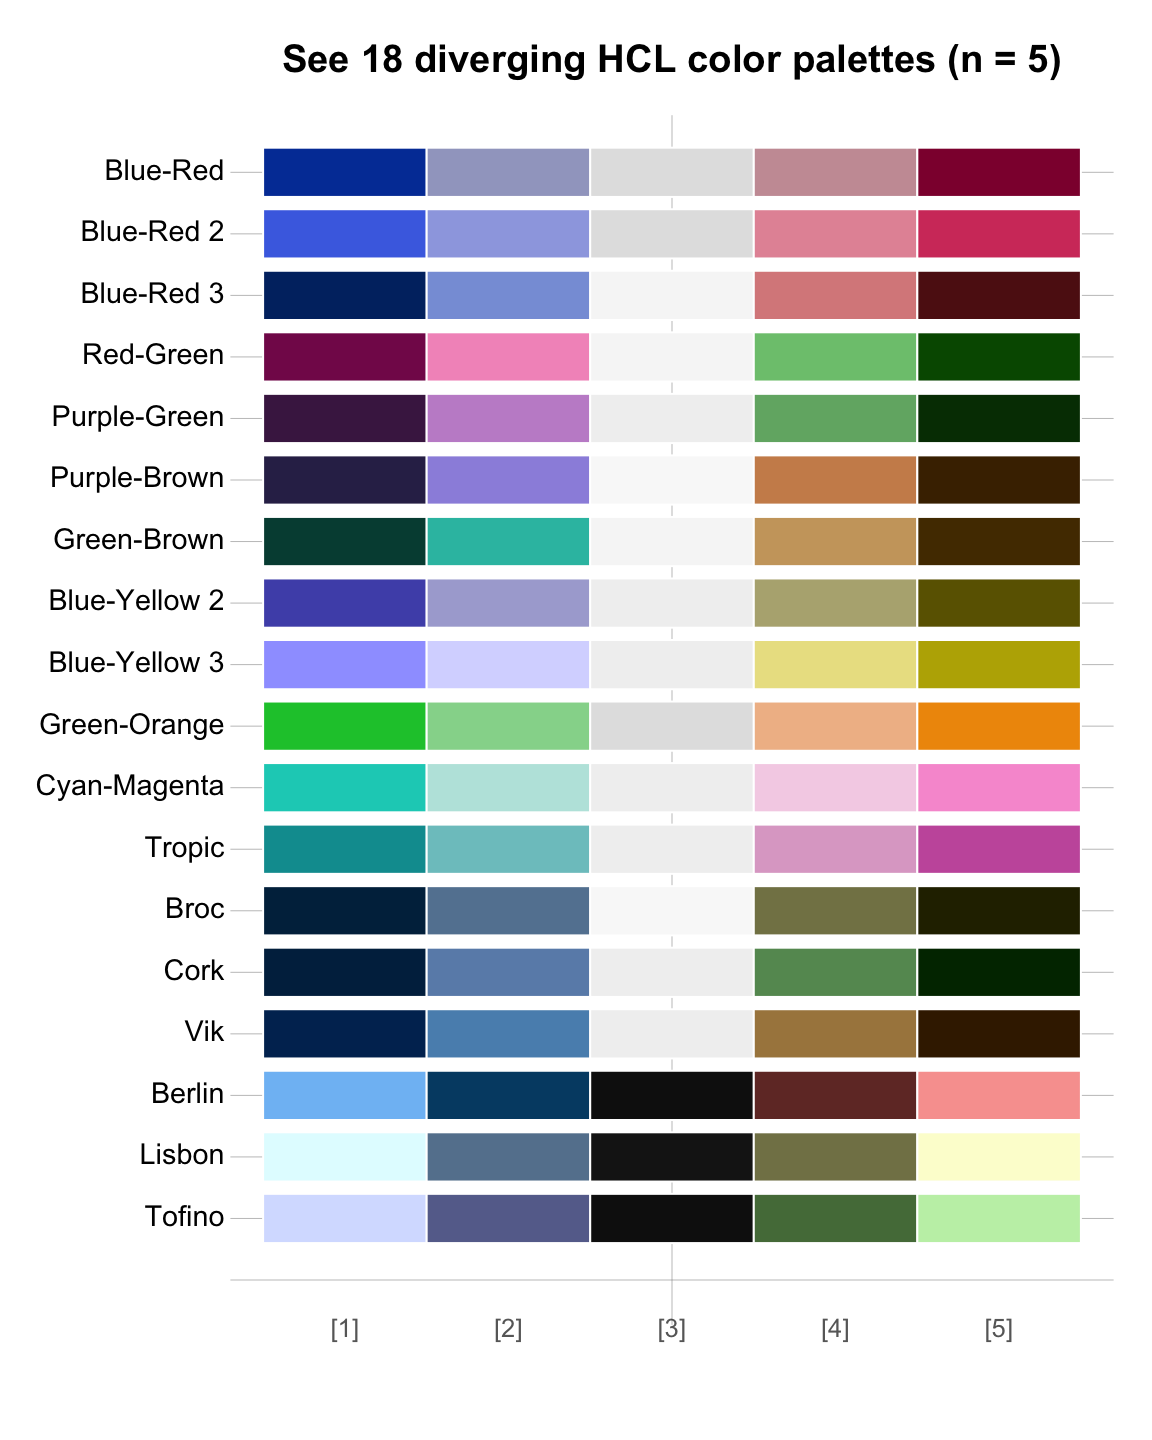
- The 18 diverging HCL color palettes combine two sequential color palettes in a balanced fashion:
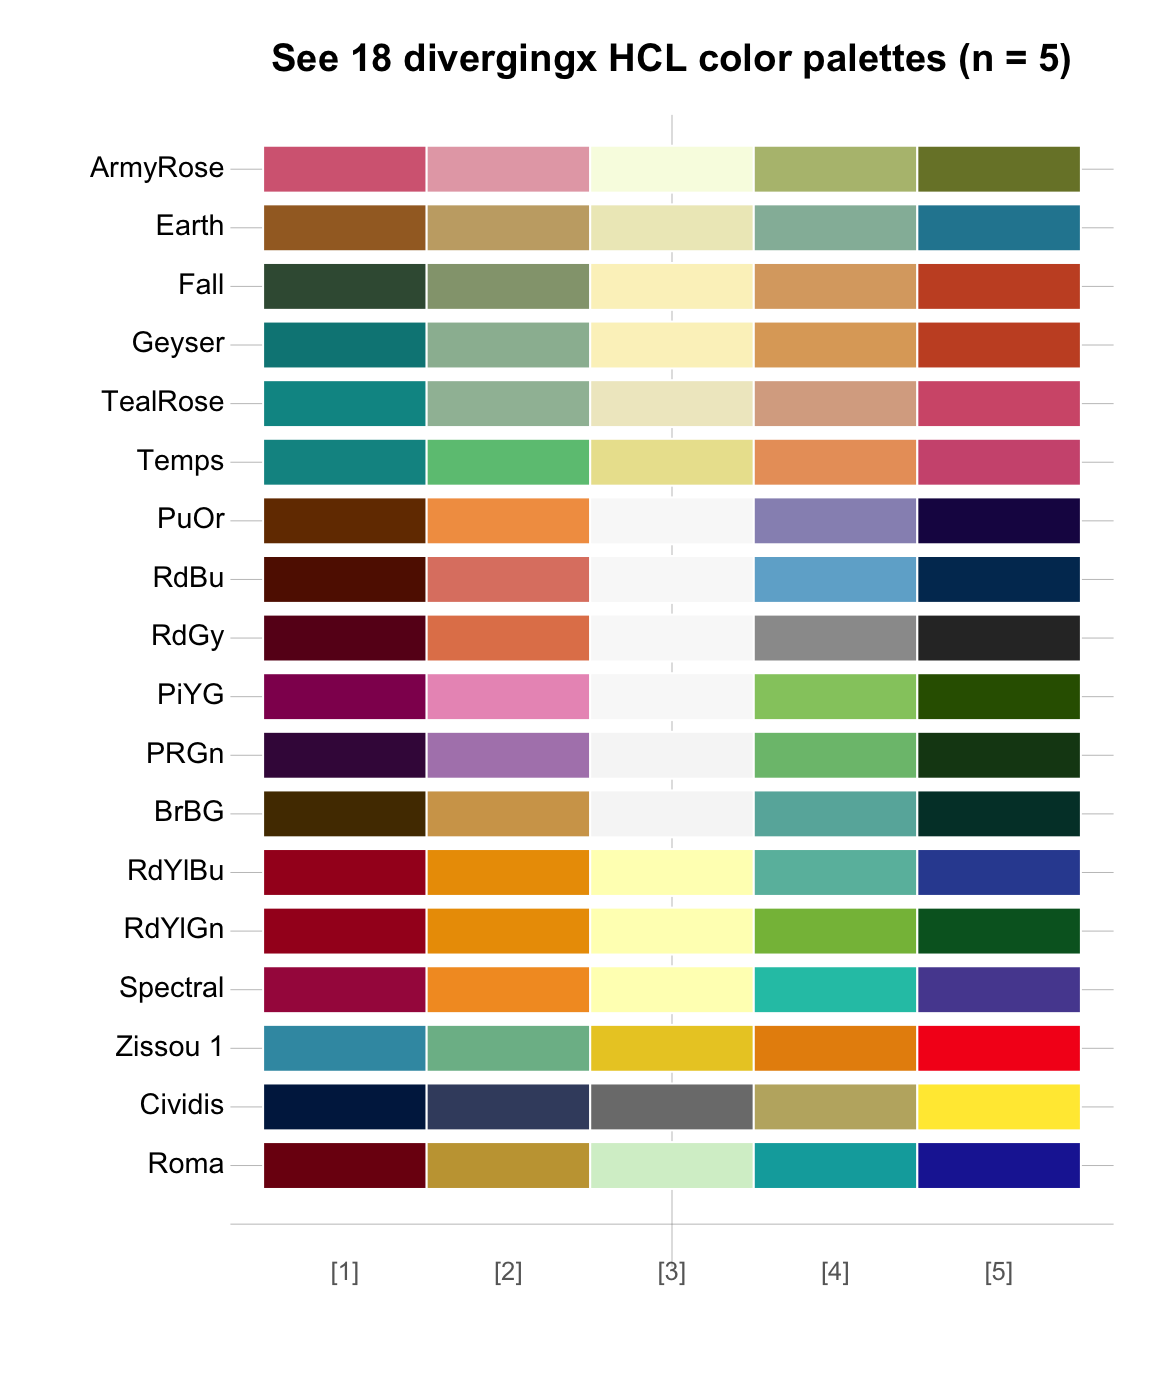
- The 17 so-called divergingx HCL color palettes combine two color hues or palettes in a more flexible fashion:
- The majority of 66 HCL color palettes are sequential color palettes:
As hcl.colors() incorporates an immense range of color palettes from other packages (e.g., ColorBrewer, viridis, scico), this powerful functionality renders many other color packages obsolete.
Nevertheless, many great R packages provide additional support for special purposes (see Section D.4 on color packages).
D.3.5 Palettes for color vision deficiencies
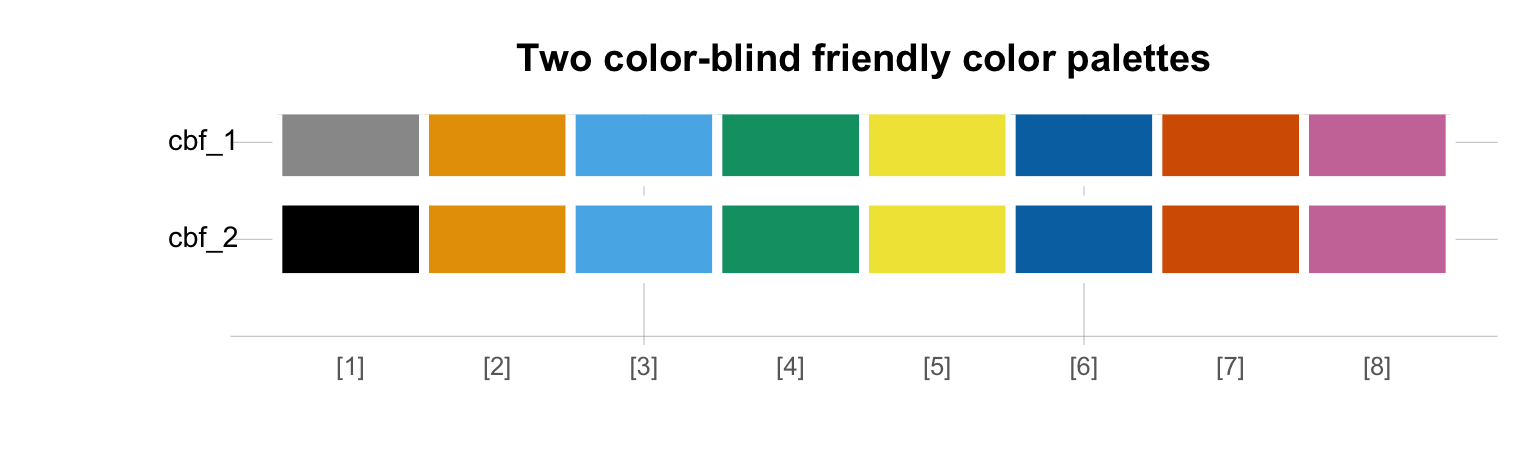
When using color, we must keep in mind that about 10% of the population is color vision impaired or color blind. Here are some ways of coping with this fact and still using color palettes that look visually friendly and beautiful for people with color vision.
A simple way to define a palette of colors that can still be distinguished by most color-blind people is discussed in the R Graphics Cookbook in this link:
# color blind friendly palette (with grey):
cbf_1 <- c("#999999", "#E69F00", "#56B4E9", "#009E73",
           "#F0E442", "#0072B2", "#D55E00", "#CC79A7")

# color_blind_friendly palette (with black):
cbf_2 <- c("#000000", "#E69F00", "#56B4E9", "#009E73",
           "#F0E442", "#0072B2", "#D55E00", "#CC79A7")
Note that the cbf_1 and cbf_2 color palettes were simply defined as vectors (with the colors specified as characters of HEX code) and only differ in their first color, which is either grey or black:
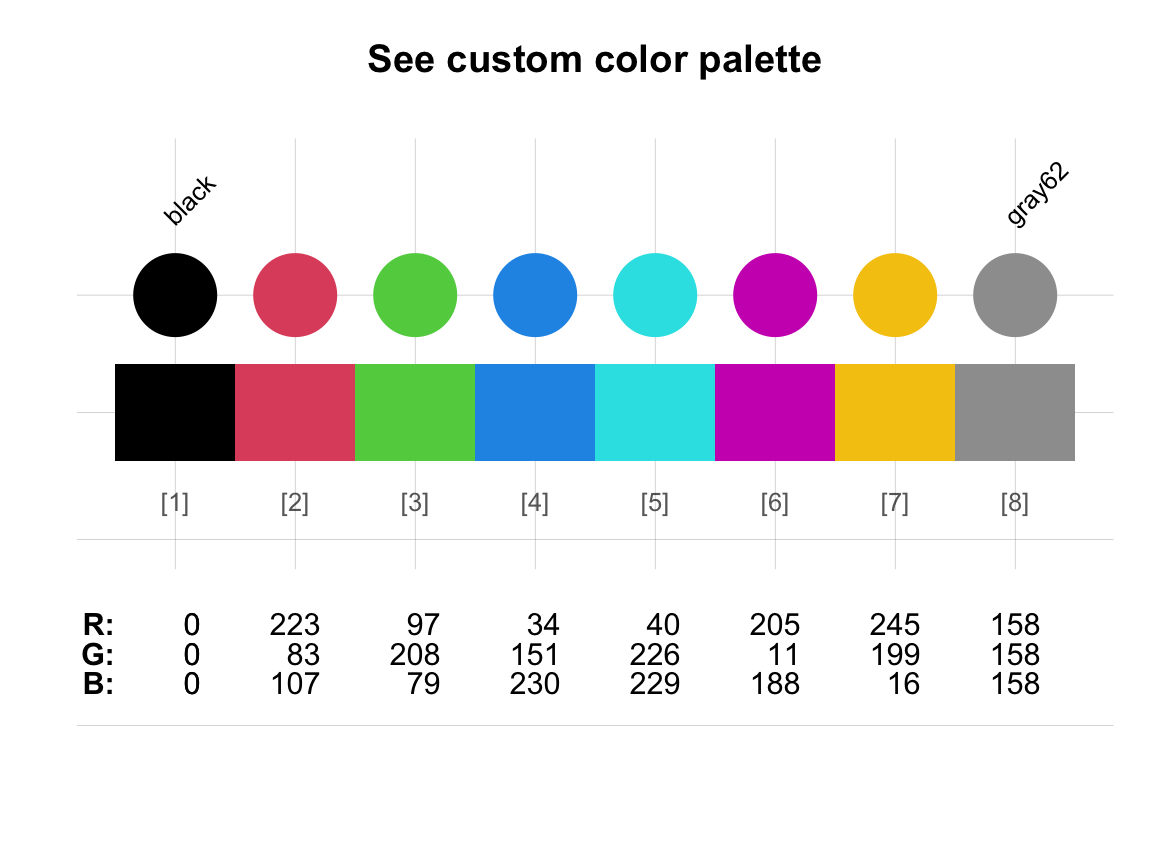
In Section D.5 (below) we will show how to provide RGB values to define a palette that implements Color Universal Design (CUD) recommendations (Okabe & Ito, 2008). But besides defining your own color palettes, we can also benefit from the designs of other people by using dedicated packages that target this issue.
D.3.6 Changing the default palette()
As mentioned above, the base R plotting system uses a color vector palette() as its default colors:
palette()  # show current default colors
#> [1] "black"   "#DF536B" "#61D04F" "#2297E6" "#28E2E5" "#CD0BBC" "#F5C710"
#> [8] "gray62"
Depending on your system settings, these defaults vary from horrible to pretty bad.
In my current system (R version 4.0.5 (2021-03-31)), palette() is pre-defined to include the following 8 colors:
Although recent R versions (from version 4.0.0 onwards) have improved considerably, it is possible (and often useful) to set the default palette to a different color palette. Here are some examples that illustrate how this can be done:
- Using the color functions of grDevices:
palette(rainbow(n = 8))
palette(topo.colors(n = 8))- Using named color palettes of
hcl.colors():
# hcl.pals()
palette(hcl.colors(8, "Viridis"))
palette(hcl.colors(8, "Zissou 1"))- Using base R color names (from
colors()) or HEX codes (e.g., fromcbf_1above) to create a custom color palette:
my_cols <- c("steelblue", "gold", "firebrick", "forestgreen",
             "orange", "white", "grey", "black")
palette(my_cols)

cbf_1 <- c("#999999", "#E69F00", "#56B4E9", "#009E73",
           "#F0E442", "#0072B2", "#D55E00", "#CC79A7")
palette(cbf_1)- Using color functions, color palettes, or color names from some other package often provides the best solution.
For instance, the following uses the
usecol()function of the unikn package (Neth & Gradwohl, 2021) to first selectn = 8colors ofpal_uniknand then to define a semi-transparent palette out of named color objects:
library(unikn)

# Use a color function with a pre-defined color palette:
palette(usecol(pal_unikn, n = 8))

# Define your own palette (from various color objects):
palette(usecol(c(Seeblau, "white", Pinky, Seegruen, Grau, # mix of names
                 Bordeaux, Petrol, Karpfenblau),          # and color objects,
               alpha = 2/3))                              # add transparency
Figure D.7 shows that most of these re-definitions of the palette() provide improvements over the default palette.
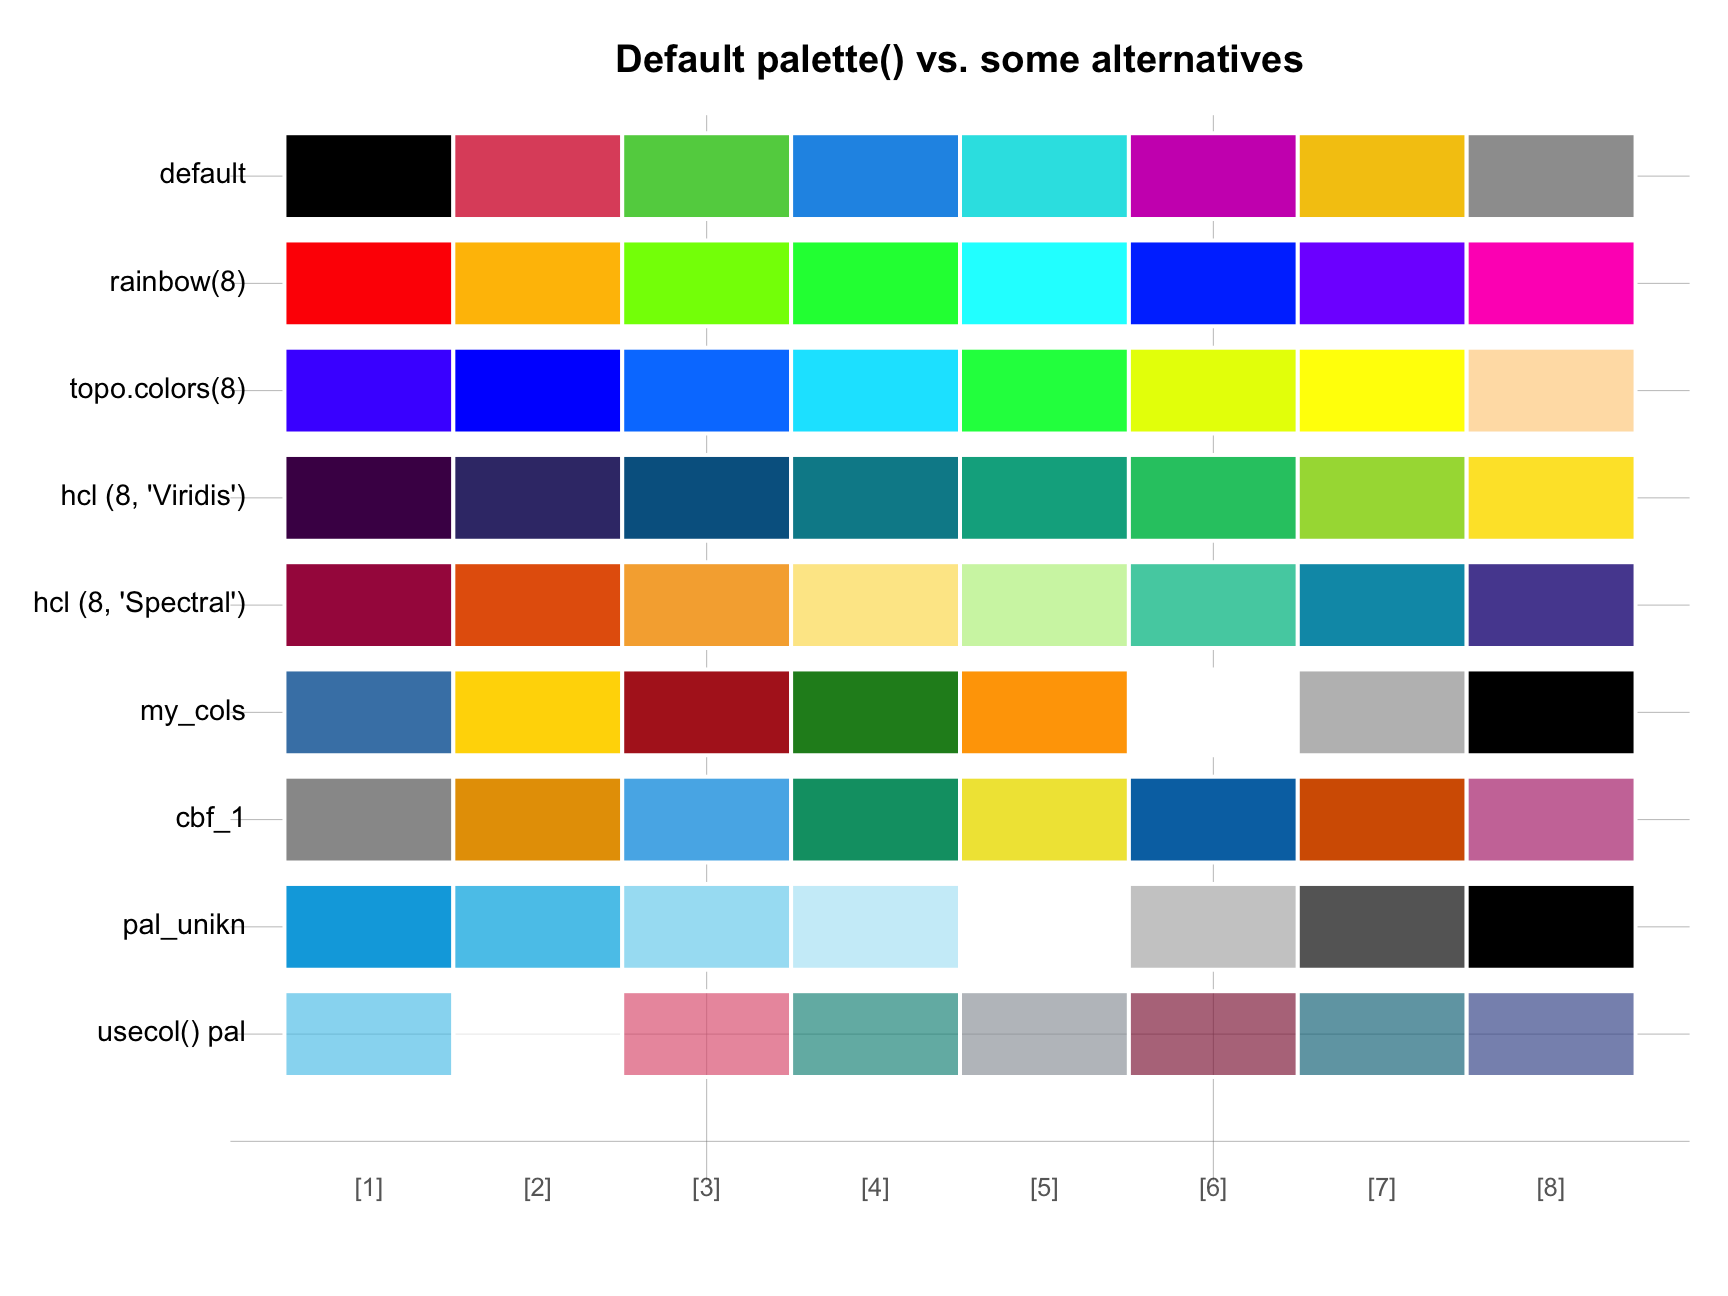
Figure D.7: Setting the default palette() to various alternative color palettes.
However, Figure D.7 also illustrates that color palettes differ on multiple dimensions — which is why it is important to occasionally change one’s color palette for tackling different tasks.
Importantly, do not forget to reset palette() after changing it.
The following restores the default colors:
palette("default") # restores default color palette