Chapter 2 Visualizing data

Apart from doing statistics and running simulations, the power to create clear and beautiful visualizations is one of the main reasons for using R. From the very start, R was conceived not just as a powerful machine for statistics, but as a language that allows for all kinds of graphical expression. As a side-effect of this dual identity, its flexibility and long history, R now possesses a variety of modules and functions that allow creating all kinds of graphs.
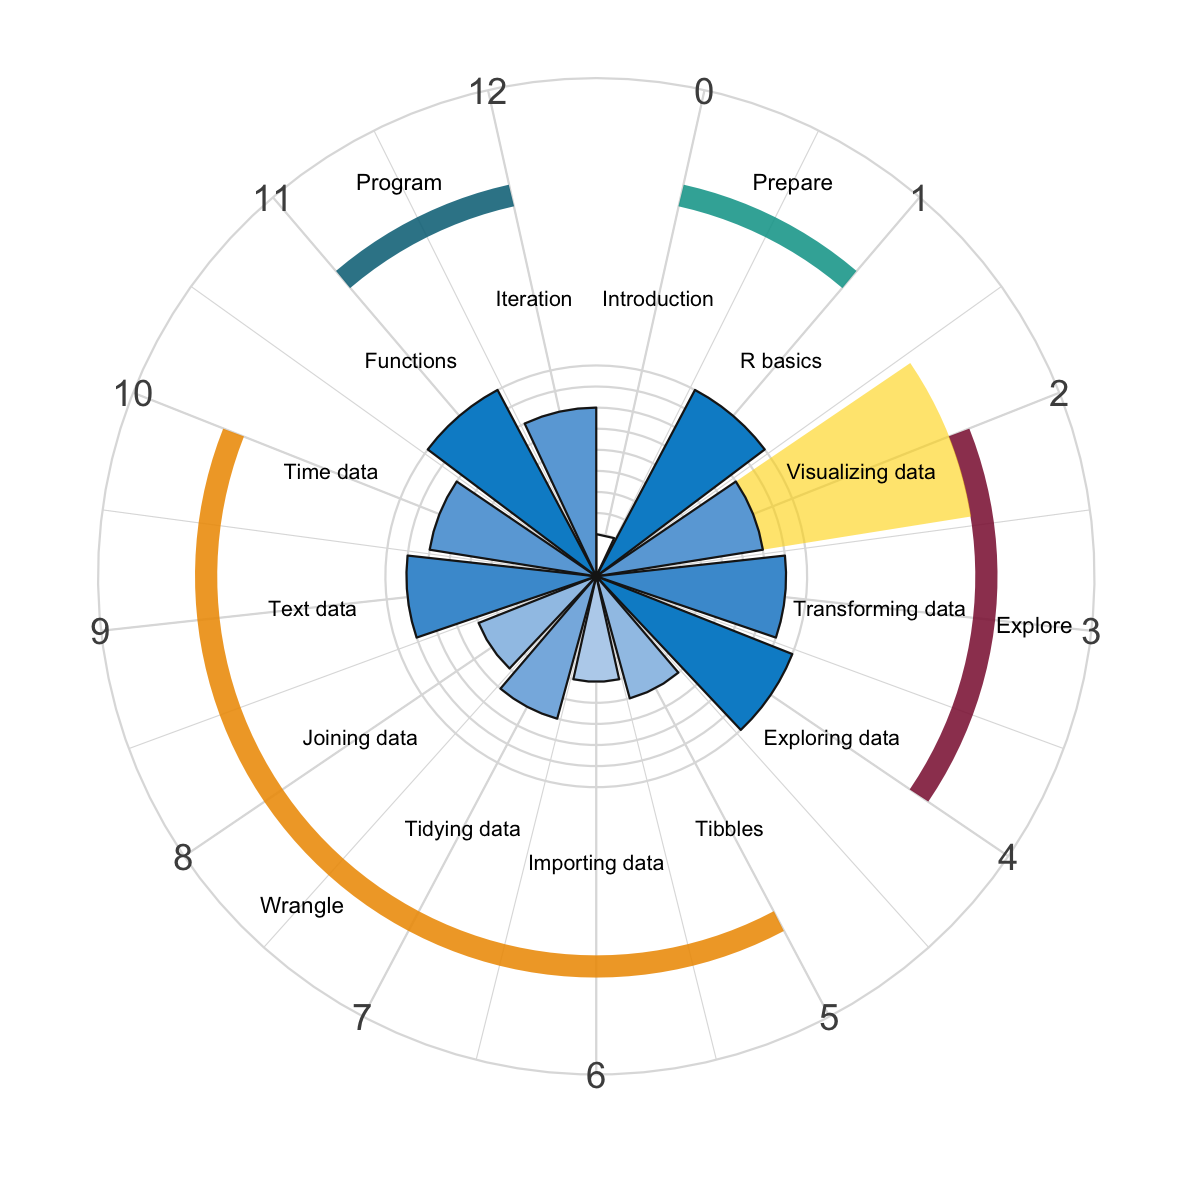
Figure 2.1: We start exploring data by visualizing it, using the ggplot2 package.
This chapter gravitates around the R package ggplot2 (Wickham, Chang, et al., 2025), which is widely used for creating scientific visualizations.30
Introducing visualizations with ggplot() at such an early point of your R-career is unusual.
We do this here in the interest of rapid prototyping and hope to excite you about the potential of R by gaining quick visual insights into data.
Such a swift and short foray into graphics is possible, as ggplot provides a concise language for graphical expression, as long as it is supplied with the right kinds of inputs. Nevertheless, some caveats are warranted:
Introducing visualizations with
ggplot()does not imply that other ways for creating graphs in R are deficient or inferior. R has powerful functions for creating graphs, and many users create beautiful visualizations in R without usingggplot(). But as ggplot2 allows creating a large variety of graphs before digging deeper into the mysteries of R and other tidyverse packages, we can start using it without knowing much about the rest of R.The functionality of the ggplot2 package extends far beyond this modest introduction. Today,
ggplot()is an important pillar of the tidyverse (Wickham, 2023), but the package was developed prior to it. Hadley Wickham created the original ggplot package in 2005 (Wickham, 2016) to provide an R implementation of The Grammar of Graphics (Wilkinson, 2005), which develops an entire language and philosophy of data visualisation. As learning to useggplot()— like learning R — is a journey, rather than a destination, we should not be surprised if some concepts remain somewhat obscure for a while. Fortunately, there is no need to understand all aboutggplot()to create awesome visualizations with it.Using
ggplot()assumes that the data to be plotted is in tabular form (a data frame or tibble) and formatted in specific ways (using factors and in so-called “long format”). At this point, we do not need to worry about this and just work with existing datasets that happen to be in the right shape.
Overall, this means that using ggplot2 is only one of many alternative ways for creating visualizations in R, can be complicated, and is not free of preconditions.
To fully realize the potential of any visualization framework, we need to learn more about transforming data in subsequent chapters.31
Keeping these caveats in mind, it is amazing and motivating to see what we can do with some basic knowledge of ggplot().
References
The current version of the ggplot package is ggplot2 (Wickham, Chang, et al., 2025), but the corresponding plotting function is still called
ggplot(). We will try to write ggplot or ggplot2 when referring to the package andggplot()to refer to the function, but trust that it will be clear what is meant from the context.↩︎For instance, we will learn how to slice and dice data into shapes suitable for plotting in Chapters 3 and 7.↩︎