2.8 Resources
This section contains links to general resources on visualization and to the ggplot2 package.
2.8.1 General publications and recommendations
R4ds and the tidyverse
The ggplot2 package is a key component and pre-cursor of the so-called tidyverse dialect or movement (Wickham et al., 2019). Hence, introductions to data science from a tidyverse perspective usually contain good introduction to ggplot2:
The r4ds textbook by Wickham & Grolemund (2017) introduces visualizations in Chapter 3: Data visualization and provides further information and examples in Chapter 7: Exploratory data analysis (EDA).
The 2nd edition of r4ds even begins with ggplot2 in Chapter 1: Data visualization (Wickham, Çetinkaya-Rundel, et al., 2023).
Articles and books (online and in print)
The most comprehensive reference on the R package ggplot2 (Wickham, Chang, et al., 2025) is Hadley Wickham’s book ggplot2: Elegant graphics for data analysis (Wickham, 2016). The package provides an implementation of The Grammar of Graphics (Wilkinson, 2005), which develops a language and philosophy of data visualization.
Articles, books, or scripts on data visualization include many classic articles or chapters [e.g., Cleveland & McGill (1985); Friendly2008]. The landmark books by Edward R. Tufte (Tufte, 2001, 2006; Tufte, Goeler, & Benson, 1990) and Jacques Bertin (e.g., Bertin, 2011) provide solid advice and many inspiring examples.
More recent publications that are geared to the needs of aspiring data scientists include:
Data Visualization. A practical introduction (Healy, 2018) is beautiful, informative, and elegant.
Fundamentals of Data Visualization (Wilke, 2019) provides many instructive examples and helps distinguishing good from bad and ugly graphs.
R Graphics Cookbook (Chang, 2012) provides hands-on advice on using ggplot2 and many useful recipes for data transformation.
Data Visualization with R (Kabacoff, 2018) relies heavily on the ggplot2 package, but also covers other approaches.
Guidelines and principles
More specific resources on the principles of data visualization (with many beautiful or bizarre examples) include:
Various books (e.g., Cairo, 2012, 2016) and The functional art weblog (by Alberto Cairo)
Various books (e.g., Yau, 2011, 2013) and the Flowing data site (by Nathan Yau)
The principle of proportional ink and the Calling bullshit weblog (by Carl T. Bergstrom and Jevin West)
Data visualization principles (by Rafael A. Irizarry)
Data visualization: Basic principles (by Peter Aldhous)
For those who prefer watching video clips:
- Essentials of data visualization provides an 8-part miniseries on thinking about drawing data and communicating science
Online collections and applications
Inspiration and tools for many types of visualizations can be found at (from specific to general):
From Data to Viz: A decision tree for selecting graphical representations, with links to code and lists of common caveats to be avoided
The Pudding uses visual essays to explain ideas debated in culture (especially pop culture)
2.8.2 Specific topics
Helpful pointers to resources on specific topics include:
Using ggplot2
The following links provide additional information on using ggplot2:
study the
vignette("ggplot")and the documentation forggplotand various geoms (e.g.,geom_);study https://ggplot2.tidyverse.org/reference/ and its examples;
study the Posit cheatsheets on data visualization:
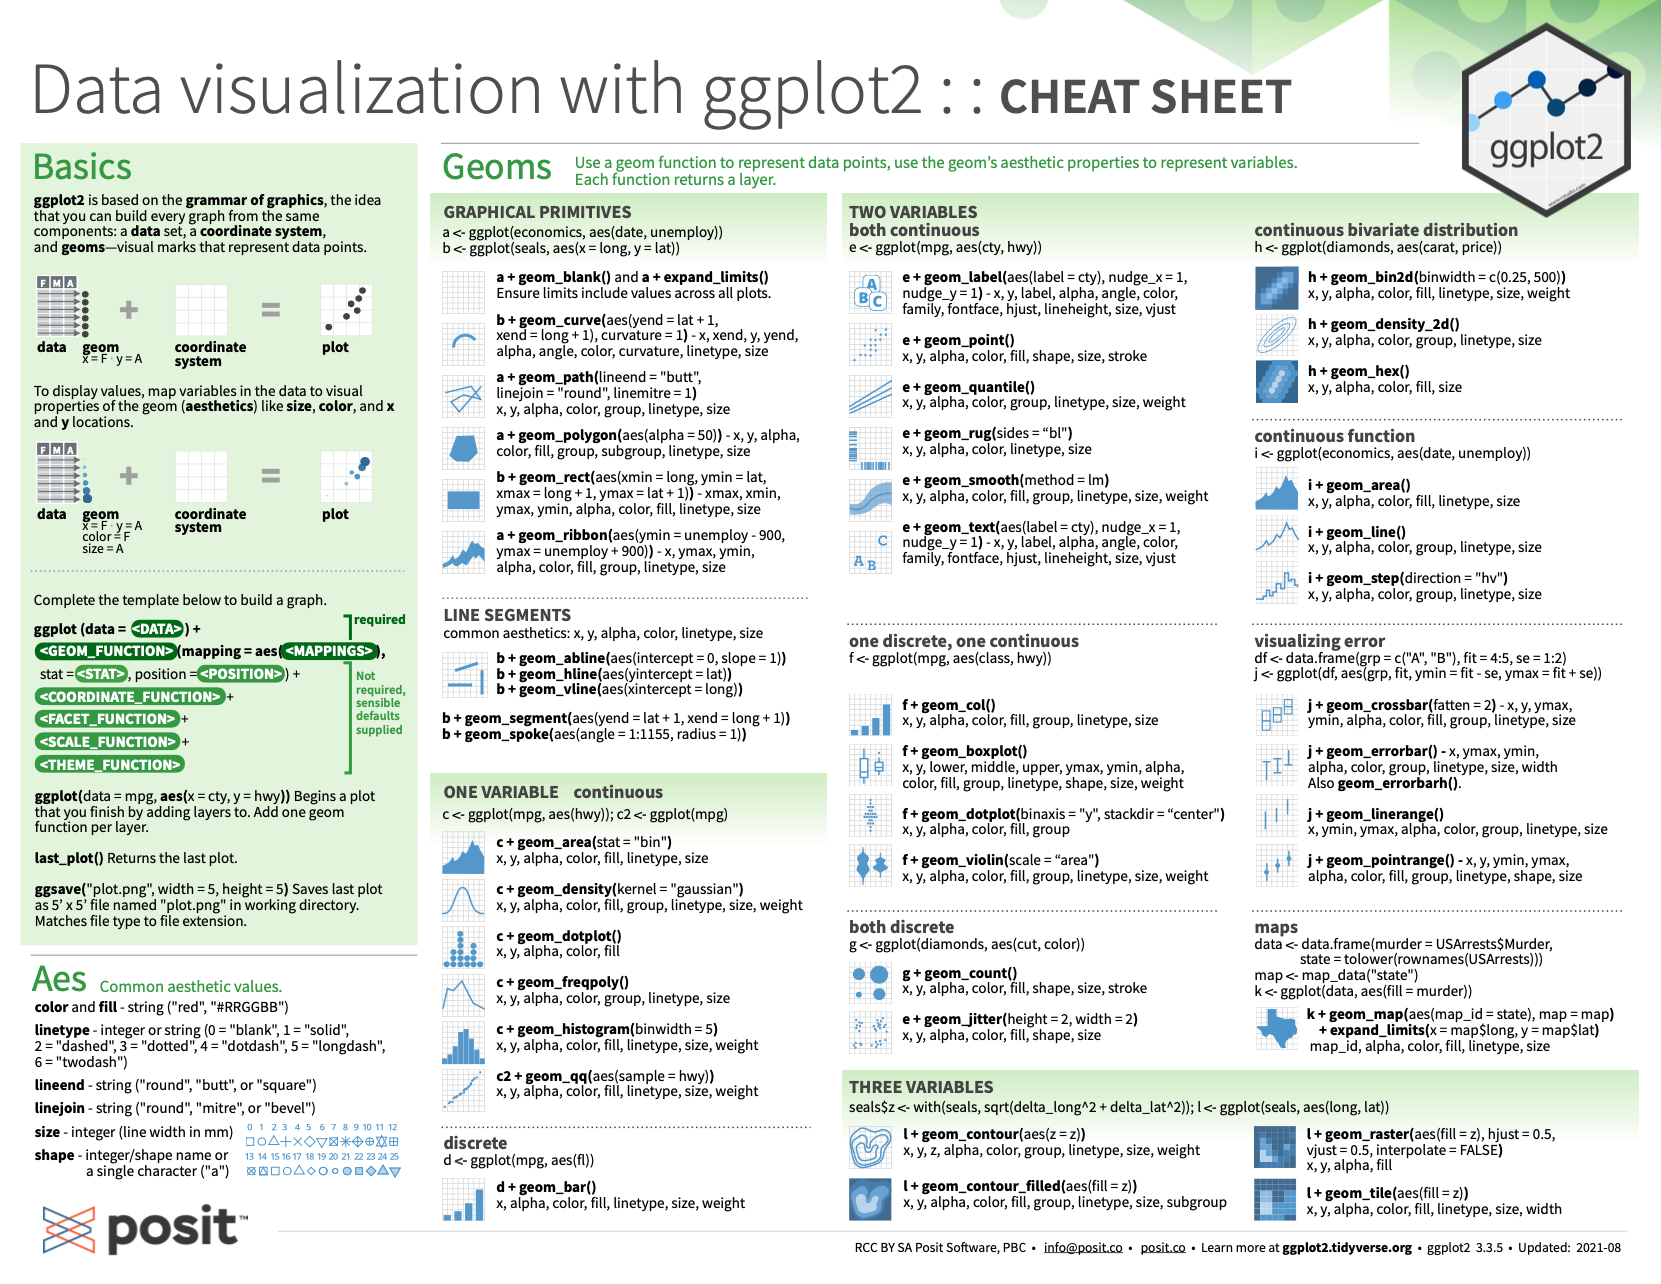
Figure 2.9: Data visualization with ggplot2 summary from Posit cheatsheets.
- The corresponding online documentation provides a good overview of key ggplot2 functionality.
Related links:
Top 50 ggplot2 Visualizations helps choosing the right charts for specific goals and tasks and shows how to create them by using ggplot2
A ggplot2 Tutorial for Beautiful Plotting in R (by Cédric Sherer, 2019-08-05) provides an introduction that focuses on aesthetics and recruits many packages that help boosting the appearance of plots
ggplot2 Extensions expand the range and scope of ggplot2 even further
2.8.2.1 Colors in R
The grDevices component of R comes with many options and tools for selecting and modifying colors:
- Call
colors()ordemo("colors")in the Console to view the in-built colors of R.
See Appendix D for a primer on using colors in R and Section D.7 for corresponding resources and links.
2.8.2.2 Explanation: Same stats, different data
The introductory data examined above (in Section 2.1 and plotted in Figure 2.2) is known as Anscombe’s quartet (Anscombe, 1973) and is included in R as anscombe in the datasets package (R Core Team, 2025).
It contains four sets of x-y coordinates which have the same statistical properties (regarding mean, SD, correlation, regression line), although their raw data values are quite different. (See ?datasets::anscombe for details.)
Related web links include:
A recent CHI paper (Matejka & Fitzmaurice, 2017) is available at https://www.autodeskresearch.com/publications/samestats
Blog posts by Alberto Cairo http://www.thefunctionalart.com/2016/08/download-datasaurus-never-trust-summary.html and David Smith https://blog.revolutionanalytics.com/2017/05/the-datasaurus-dozen.html
The datasauRus package (Gillespie, Locke, Davies, & D’Agostino McGowan, 2025): https://CRAN.R-project.org/package=datasauRus
As visualizations help us to make sense of data, they appear in most chapters of this book (e.g., Chapter 4 on Exploring data). Many of them are created by ggplot2.
For an introduction to visualizing data in base R, see Chapter 8: Visualize in R of the i2ds book (Neth, 2026).

[02_visualize.Rmd updated on 2026-01-14 by hn.]