Chapter 3 Transforming data

In most courses on data analysis and statistics, data is the raw material that is read into some software program and we immediately start analyzing it.
This was also the case for our introduction to Visualizing data in the previous Chapter 2: When composing a new ggplot() function, we only specified data = mpg and then accessed the variables of a dataset that came with the ggplot2 package. Similarly, we frequently use datasets included in the ds4psy package throughout this book.
Directly accessing data that is pre-packaged in some simple form is fast and easy, but the convenience comes at a price: Viewing data as some resource to be read in one initial step is a gross over-simplification of what typically happens when we analyze real-world data. Instead, directly using a dataset is only possible when the data is formatted in precisely the way we need it to be in our analysis. In most realistic scenarios, however, a dataset requires extensive pre-processing prior to becoming useful and answering a research question. This pre-processing phase has been called “data munging”, “data wrangling”, or simply “data transformation”, and can often get quite extensive. In fact, transforming data into the right shape can easily take up the majority of time needed to make sense of it.
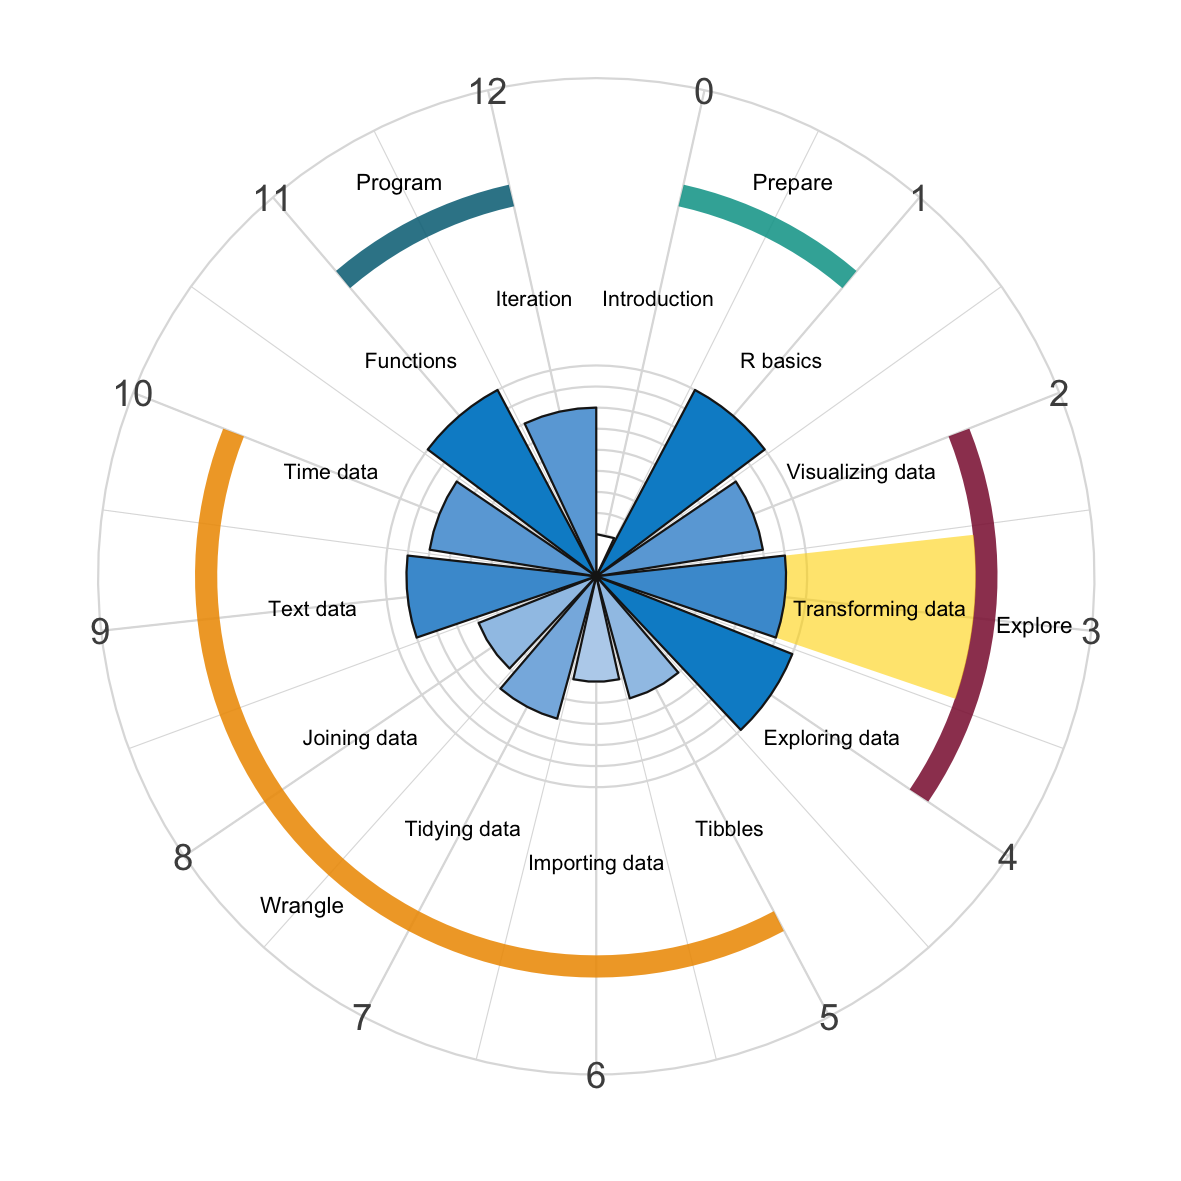
Figure 3.1: Transforming data using the dplyr package.
The topic of data transformation encompasses many different tasks, including re-arranging, selecting, changing, and aggregating data. A tool supporting these tasks is the dplyr package (Wickham, François, Henry, Müller, & Vaughan, 2023), which is a core component of the tidyverse. Like ggplot2, dplyr is widely used by people who otherwise do not reside within the tidyverse. But as dplyr is a package that is both immensely useful and embodies many of the tidyverse principles in paradigmatic form, we can think of it as the primary citizen of the tidyverse.
dplyr provides a set of functions — best thought of as verbs — that allow slicing and dicing rectangular data tables and computing many summary statistics. While each individual command is simple, they can be combined into a powerful language of data manipulation. In combination with other functions, using dplyr quickly provides us with quantitative overviews of datasets that amount to what psychologists often call descriptive statistics.
In this chapter, we are only concerned with the essentials, as the subsequent chapters will cover many related tasks and tools in greater detail. Similarly, the tools provided by the dplyr package extend beyond the scope of this introduction. For instance, dplyr includes additional commands for handling multiple data tables, which we will discuss later (e.g., in Chapter 8 on Joining data).