Chapter 4 Exploring data

This chapter introduces the notion of exploratory data analysis (EDA) which is a key component of data science and an important pre-requisite for statistics.
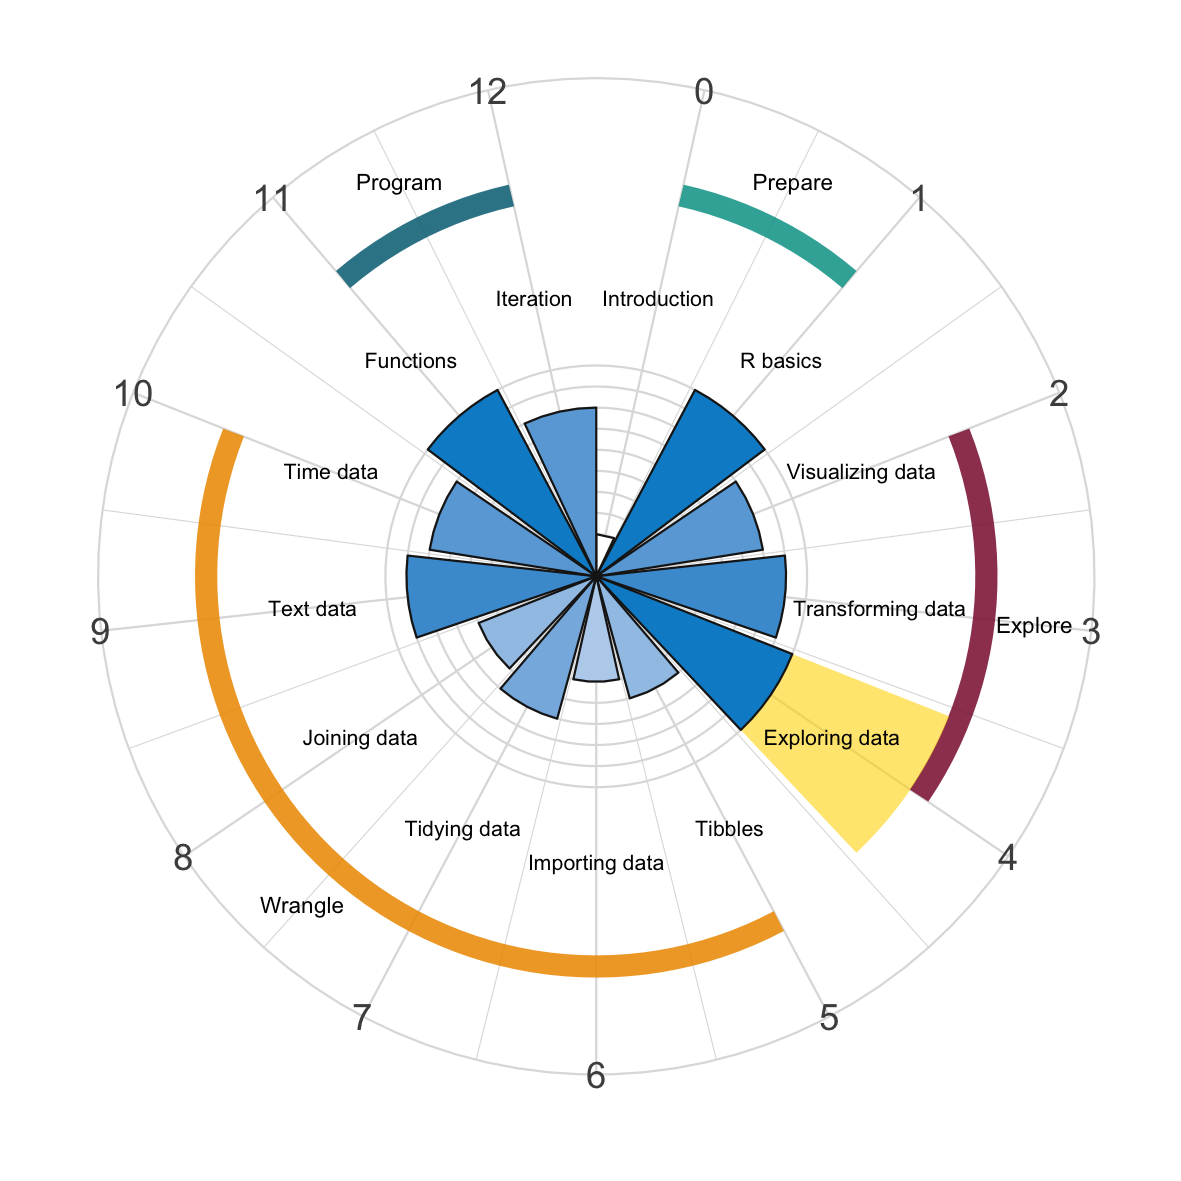
Figure 4.1: Exploratory data analysis (EDA) is the final chapter in this part.
Here, we use the dplyr and ggplot2 packages to explore and understand data.
EDA comprises one of the most important parts of data analysis — and one that is often ignored or under-estimated in typical courses on statistics. Especially when subscribing to the principles of transparent data analysis and reproducible research (e.g., by sharing analysis notebooks in R Markdown, see Appendix F), a solid EDA allows establishing consensus about the main characteristics of a dataset. While such practices are indispensable when working in a team of colleagues and the wider scientific community, organizing our workflow in a clear and consistent fashion is also beneficial for our own projects and our future self.
Although any actual EDA is tailored to specific features of a dataset and the current research goals, this session highlights some common themes that are relevant in most cases. We illustrate the essential steps of an EDA by exploring a real dataset from clincial psychology (Woodworth et al., 2018), which measures the effects of positive psychology interventions (see Section B.1 of Appendix B for details on the data).