D.2 Essentials of color
Issues of colors are surprisingly complicated — even when only considering those that arise in R. As our ways of perceiving colors are based on perceptual processes, experience, and language, a theoretical understanding of color is an ambitious inter-disciplinary endeavor at the intersection of aesthetics, humanities, and science. (See the Wikipedia articles on color vision and color theory to get started.)
From a practical point of view, most people using R for creating beautiful visualizations never need to worry about the theoretical underpinnings of color systems.79 Fortunately, R comes loaded with tools for dealing with color and a range of packages offer an abundance of pre-defined color palettes.
D.2.1 Colors vs. color palettes
Before digging any deeper into the realm of colors, it is useful to distinguish between individual colors (like "red" or "green") and color palettes (aka. color scales or color maps), which are sets or ordered sequences of colors that somehow belong together, based on some abstract principle or someone’s personal preference.
Individual colors
As an example for an individual color, the unikn package (Neth & Gradwohl, 2021) provides the color Seeblau, as an individual color that can be named, perceived, and described in different ways:
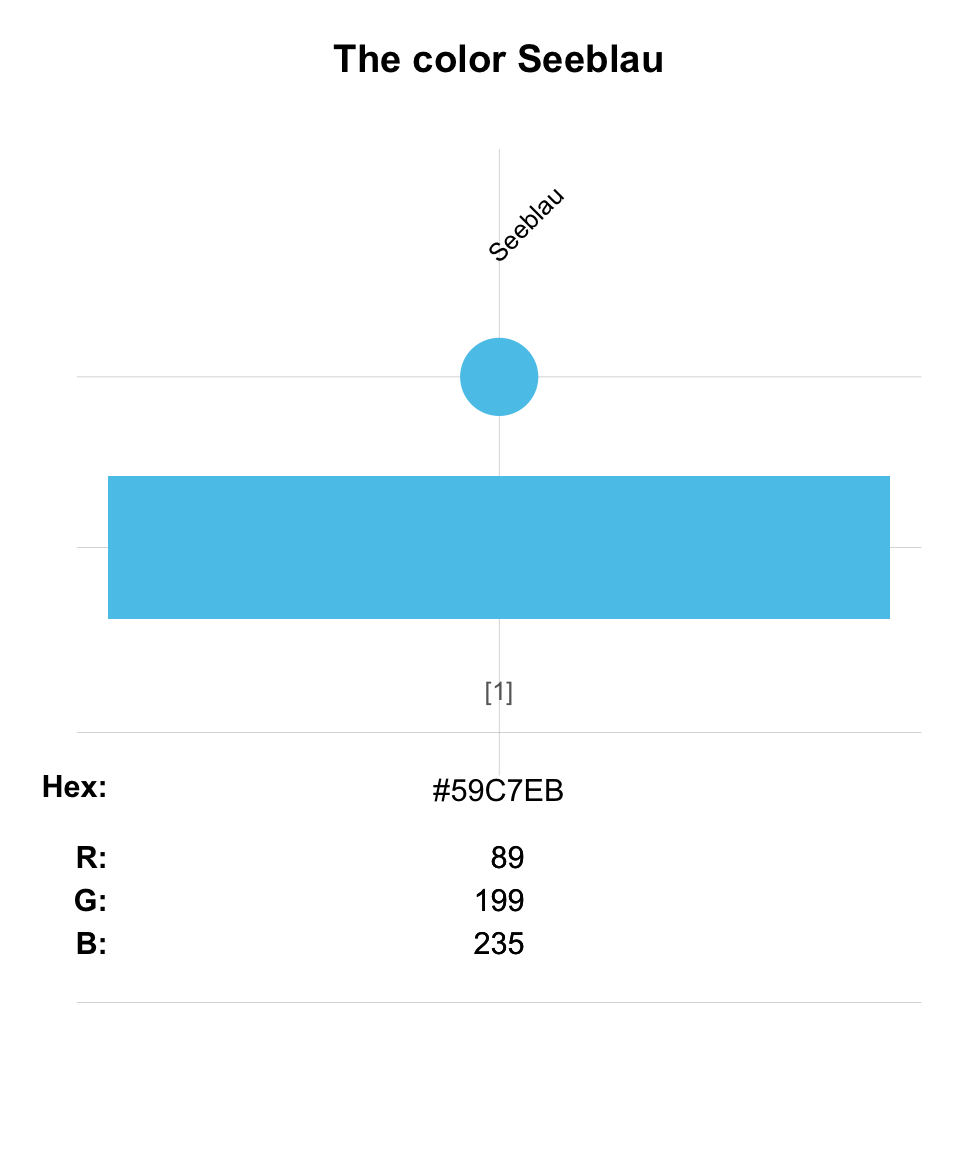
Figure D.1: Example of the Seeblau color and corresponding details (i.e, its name and ways of encoding it).
The color shown in Figure D.1 is defined as an R object Seeblau.
Internally, this color object is represented as a character vector that has a name (i.e., “Seeblau”) and can be expressed by the HEX code “#59C7EB” or by a triple of RGB values (89, 199, 235).
Abbreviations like HEX, RGB, and HCL refer to different systems of encoding colors. With these codes, it is possible to transfer and show the same color on different systems, though some features — like transparency — may be device-dependent.
We will discuss different ways of defining colors below (in Section D.5). Right now, it only matters that all these representations refer to the same bluish color.
To get a first glimpse of the complexities of issues surrounding the definitions of color, inspect the following graph:
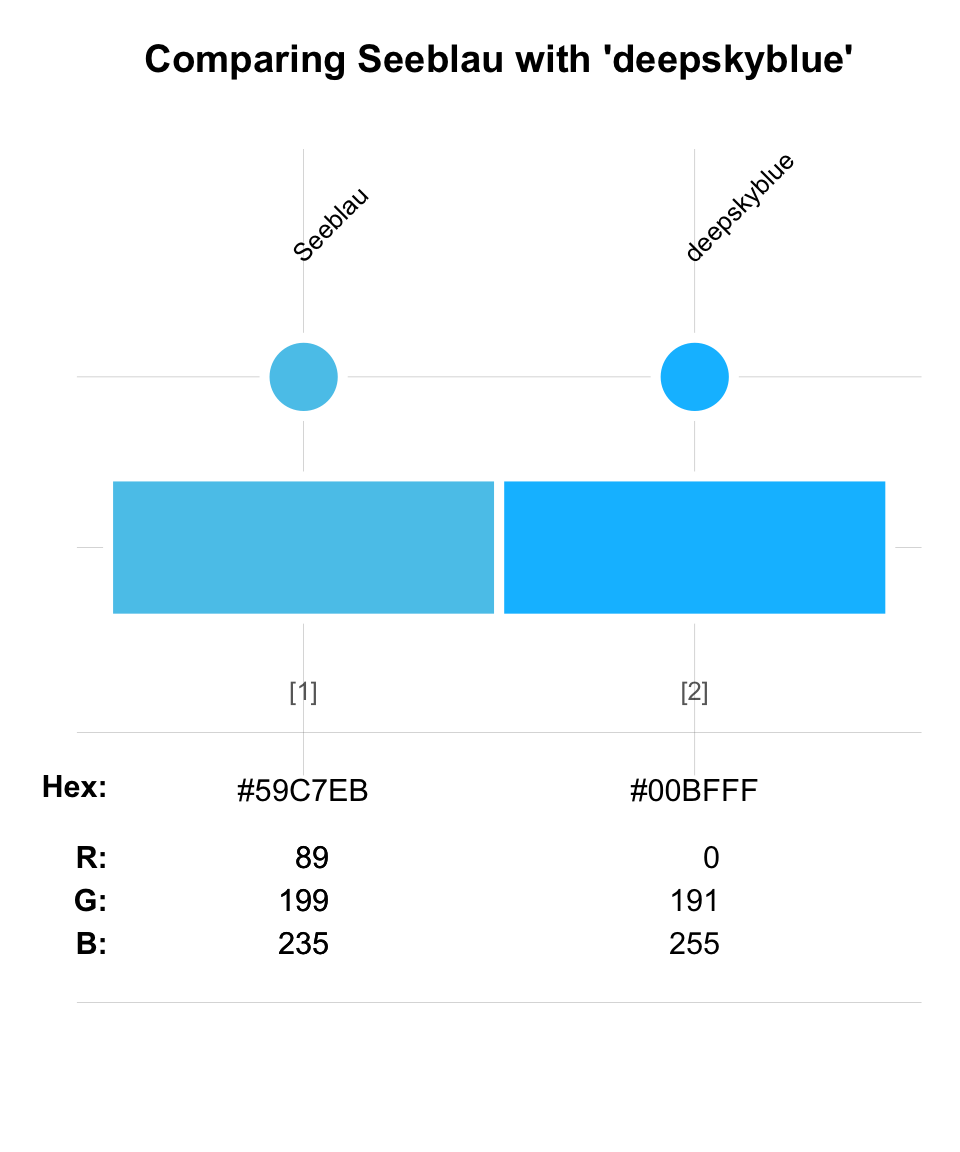
Figure D.2: Comparing the color Seeblau with the color "deepskyblue".
In many respects, the two colors called “Seeblau” and “deepskyblue” are quite similar. Although this may be easy to see — or “obvious” — it is difficult to explain what “being similar” actually means. For instance, both colors are brighter than black, and not very red — but this would be true for many other colors as well. Most people with ordinary color vision would state that both colors show a similar shade of blue, but the former seems a slightly muted version of the latter. In other respects, however, the two colors are quite different (e.g., see their different names, HEX codes, and RGB values). This illustrates that “\(A\) is similar to \(B\)” is an empty phrase, unless it is specified on which dimension or variable \(A\) and \(B\) are being assessed and compared.
Color palettes
When combining a color with one or more other colors, we get a color palette (or color scale).
Ideally, color palettes do not just contain a random set of colors, but are organized by some principle.
For instance, the color Seeblau occurs not only in isolation, but also as the 3rd element of the color palette pal_seeblau, which contains five different intensities of a color with very similar hue (or tint):
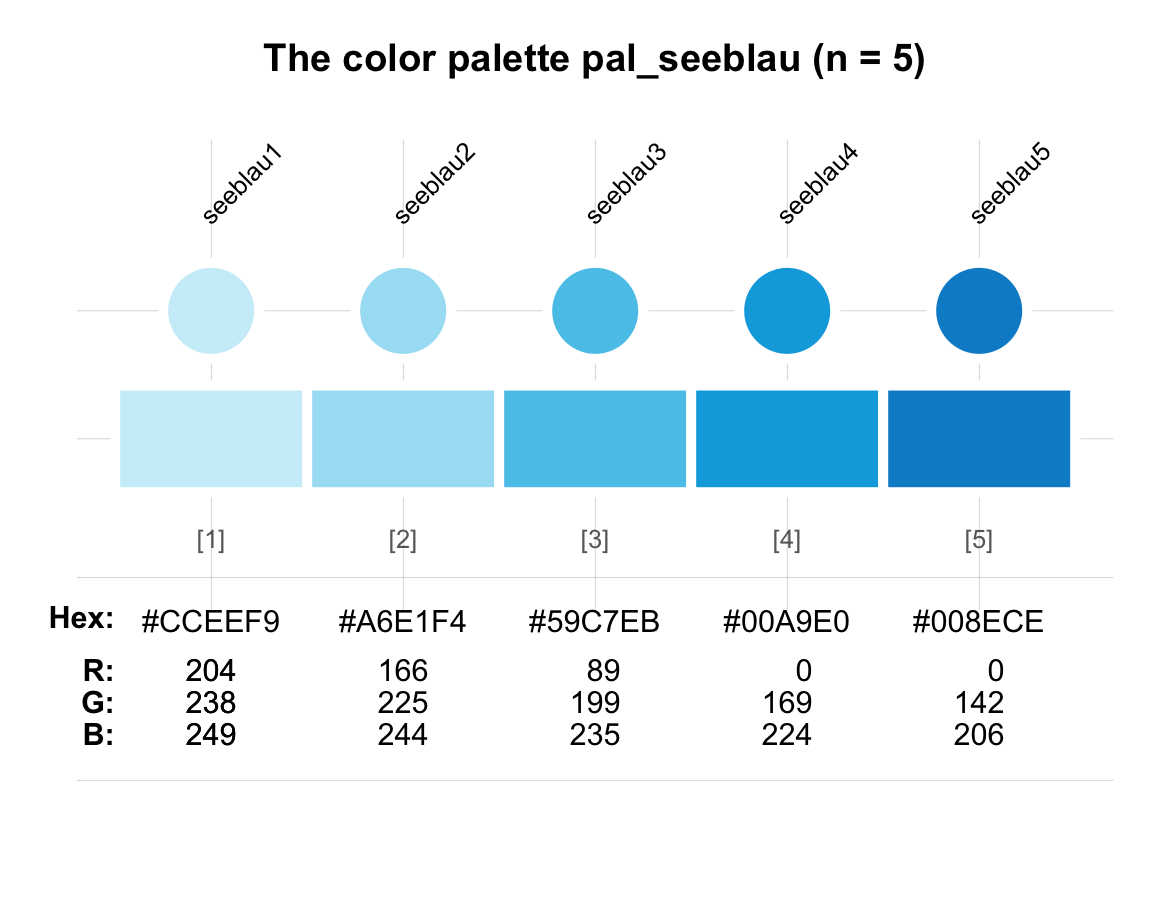
Note that the same color now appears with the name seeblau3 in this color palette.
As it can be difficult to distinguish between the different shades of a color, the HEX and RGB codes assure us that the color named “seeblau3” in pal_seeblau is identical to Seeblau from above.
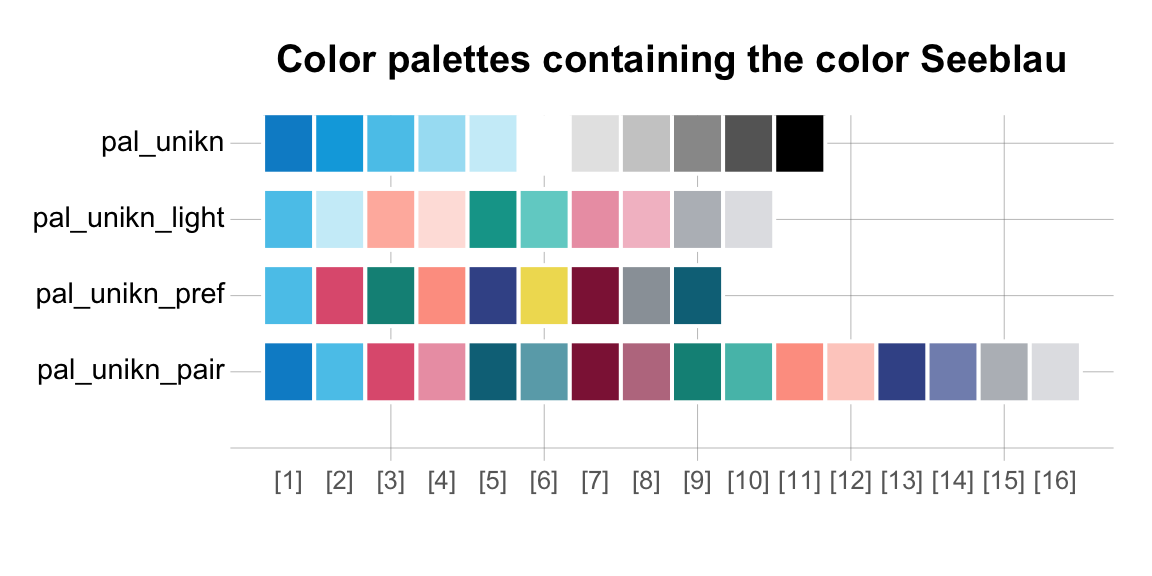
The same color can also occur as an element of various other color palettes:
When discussing ways of choosing or combining colors, we rarely focus on individual colors, but typically refer to color palettes. However, as any color palette consists of individual colors, we need to understand individual colors before addressing color palettes.
The perplexing complexity of colors
Most people are surprised when learning that color is not inherent in objects. Instead, what we perceive as color is a portion of light reflected from an object, and transmitted by a long chain of information processing steps that encode and decode color information in various ways. A specific color is perceived via its hue or tint (i.e., yellow, orange, red, violet, blue, or green), and its luminosity (i.e., the hue’s level of brightness). The light reflected from surfaces is first transmitted by physical processes (i.e., as wavelength and energy), processed by the physiology of our eyes (i.e., rod cells transmitting lightness and cone cells transmitting hue), and finally translated into color information in our brains. Thus, seeing a color may seem simple, but is the result of a complex and highly volatile process.
One of the most perplexing aspects of color perception is their profound dependency on context. While there is a lively debate whether “white” is a color (see Wikipedia: White), any photographer can tell us that a “white” surface looks totally different throughout a day. Similarly, you probably found the color “Seeblau” quite vibrant (in Figure D.1 above), but seeing it next to “deepskyblue” (in Figure D.2) alters this impression. If such changes occur when seeing only two colors next to each other, imagine how these dependencies multiply when viewing a larger palette of colors.
More generally, colors may not exist in objects, but are also more then mere reflections of light, as they play important roles in our perception of our world. Importantly, colors are not just visual experiences, but also concepts that convey meanings and connotations without and beyond seeing anything. Our language uses color to express many cognitive and emotional phenomena. For instance, it is pretty “obvious” that color names and color phrases — like “black” vs. “white,” “getting the blues,” “green washing,” or “in the red” — transport semantic messages even in the absence of vision. Again, the complexity increases when we think of visual communications and the combined effects of colors and labels.
Overall, the seemingly simple act of adding color to a visualization not only needs to take into account the features of the visualization, but the ecological rationality (in the sense of Todd, Gigerenzer, & the ABC Research Group, 2012) of the entire system. For instance, in which form and context will the visualizations appear? What message do we want to convey? Who will be viewing it?
But before getting all dizzy, let’s adopt a pragmatical approach and ask: What do we typically want to achieve by adding color to a visualization? This leads us to distinguish between different functions of color and corresponding types of color palettes.
D.2.2 The functions of color
Beyond sending tingling sensations to our retinas and brains, color adds solid functionality to visual represenations. But which functions does color serve in visualizations? Apart from making graphs prettier and more pleasant to look at, we can identify three key functions for using color in graphs:
Distinguish between different categorical groups;
Distinguish between the levels of continuous values;
Highlight selected visual elements.
These three functions roughly correspond to different types of color palettes.
D.2.3 Types of color palettes
As we rarely need only one color, we will focus on color palettes here, rather than on individual colors. Which color palette to use when depends on a range of factors (e.g., the number of distinctions to make, the number and spatial layout of elements in a graph, etc.), but we can generally map different types of color palettes to the three different functions:
Use qualitative color palettes to distinguish between different kinds of a categorical variable;
Use sequential or diverging color palettes to distinguish between the levels of a continuous variable;
Use hybrid color palettes for conveying more complex messages. For instance, paired color palettes combine qualitative and sequential aspects. Similarly, sequential color scales with accent colors emphasize both continuity and contrasts to highlight some elements.
Other taxonomies of color palettes exist. For instance, the paletteer package primarily distinguishes between discrete and continuous palettes. Within the class of discrete palettes, fixed width palettes are distinguished from dynamic palettes. (Both continuous and dynamic palettes are sequential.)
Here are some examples that illustrate the different types of color palettes:
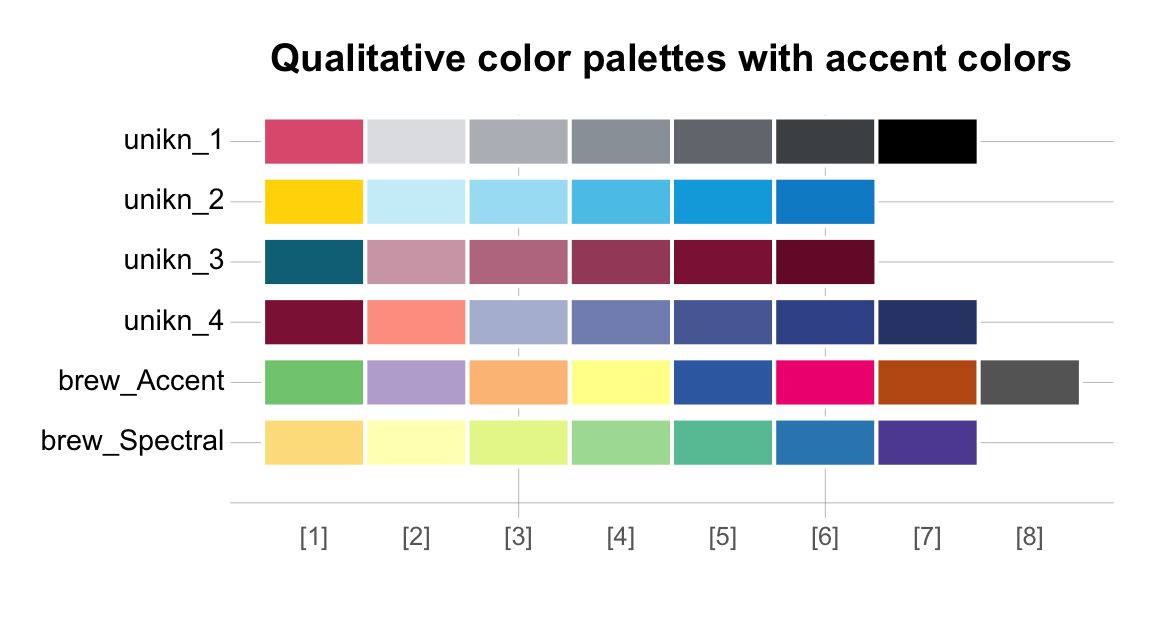
Qualitative color palettes
Qualitative color palettes allow distinguishing between different kinds or groups. Consecutive colors show large differences, so that the corresponding elements are easy to distinguish:

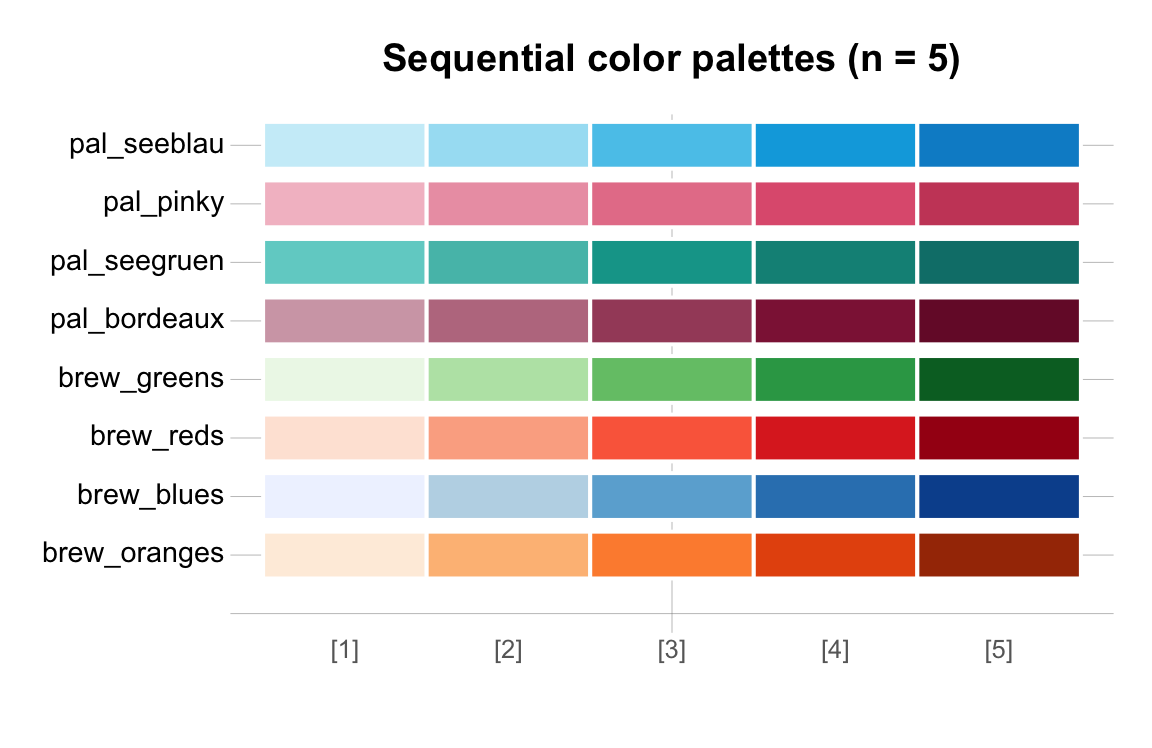
Sequential color palettes
Sequential color palettes also allow distinguishing between different colors, but the entire range of colors belonging to the same palette follows some common principle. For instance, the following colors vary the same basic color from a ligher to a darker shade:
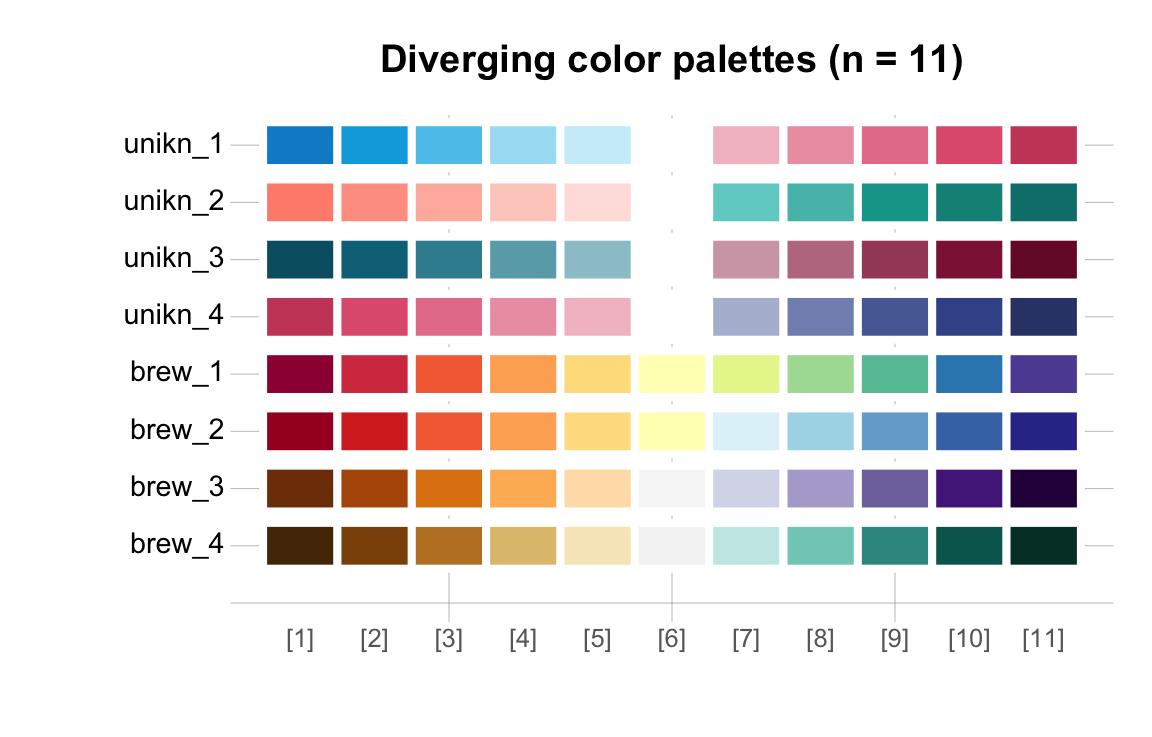
Diverging color palettes
Diverging color palettes are a special type of sequential color palette. They typically contain two distinct poles and a third color in the middle, so that the entire palette appears like a combination of two sequential color palettes:
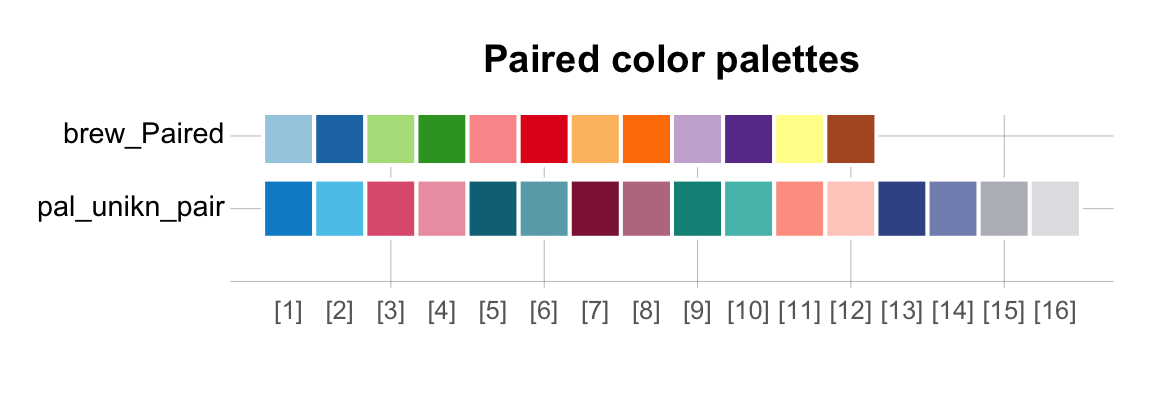
Hybrid color palettes
We often find combinations of color palettes with qualitative and sequential aspects:
- Paired color palettes combine a qualitative color palette with some sequential elements:
- Sequential color palettes with accent colors combine a range of sequential color differences with a noticeable qualitative contrast:
When choosing a color palette for a graph, we should primarily consider the function that color serves in this particular graph. In addition, considering the semantics of individual colors and aiming for consistency with other representations typically guides and limits our options. Simultaneously satisfying many different constraints can make the selection of colors both challenging and intellectually stimulating. Essentially, choosing good colors requires understanding the message to be conveyed by a visualization.
D.2.4 Finding or defining colors?
When looking for nice and useful colors, most people’s needs fall into one of two possible categories:
Find a color or color palette that suits my current goals.
Define a new color or color palette that suits my current goals.
Once we have found or defined a color or color palette, we need to know how we can use it for creating visualizations in R. We discuss various ways of addressing these needs in the following sections:
Section D.3: Basic R colors shows how we can find and select colors in base R.
Section D.4: Using color packages shows how a variety of packages provide additional colors, color palettes, and corresponding functions.
Section D.5: Defining and using custom colors shows how to create and use new colors and color palettes.
References
A basic understanding of color perception typically certainly helps in choosing better color palettes, but understanding the details of color theory is not a necessary prerequisite for creating beautiful visualizations.↩︎