2.6 Summary

This chapter introduced basic ways of visualizing tabular data using the ggplot2 package.
After working through this chapter, you should be able to:
- explain why we should always aim for a transparent visualization of data;
- know the basic structure of a
ggplot()function call; - distinguish between various types of plots (e.g., scatterplots, histograms, bar plots, line graphs);
- use different geoms to create these plots;
- adjust the aesthetic properties (e.g., colors, shapes) of plots;
- adjust the axes, legends, and titles of plots.
We only scratched the surface of the ggplot2 package, as this includes many more commands and options (aesthetics, geoms, scales, statistics, etc.). Take a look at the RStudio cheatsheet on data visualization to check which commands you are now familiar with and which others you can still discover in the future:
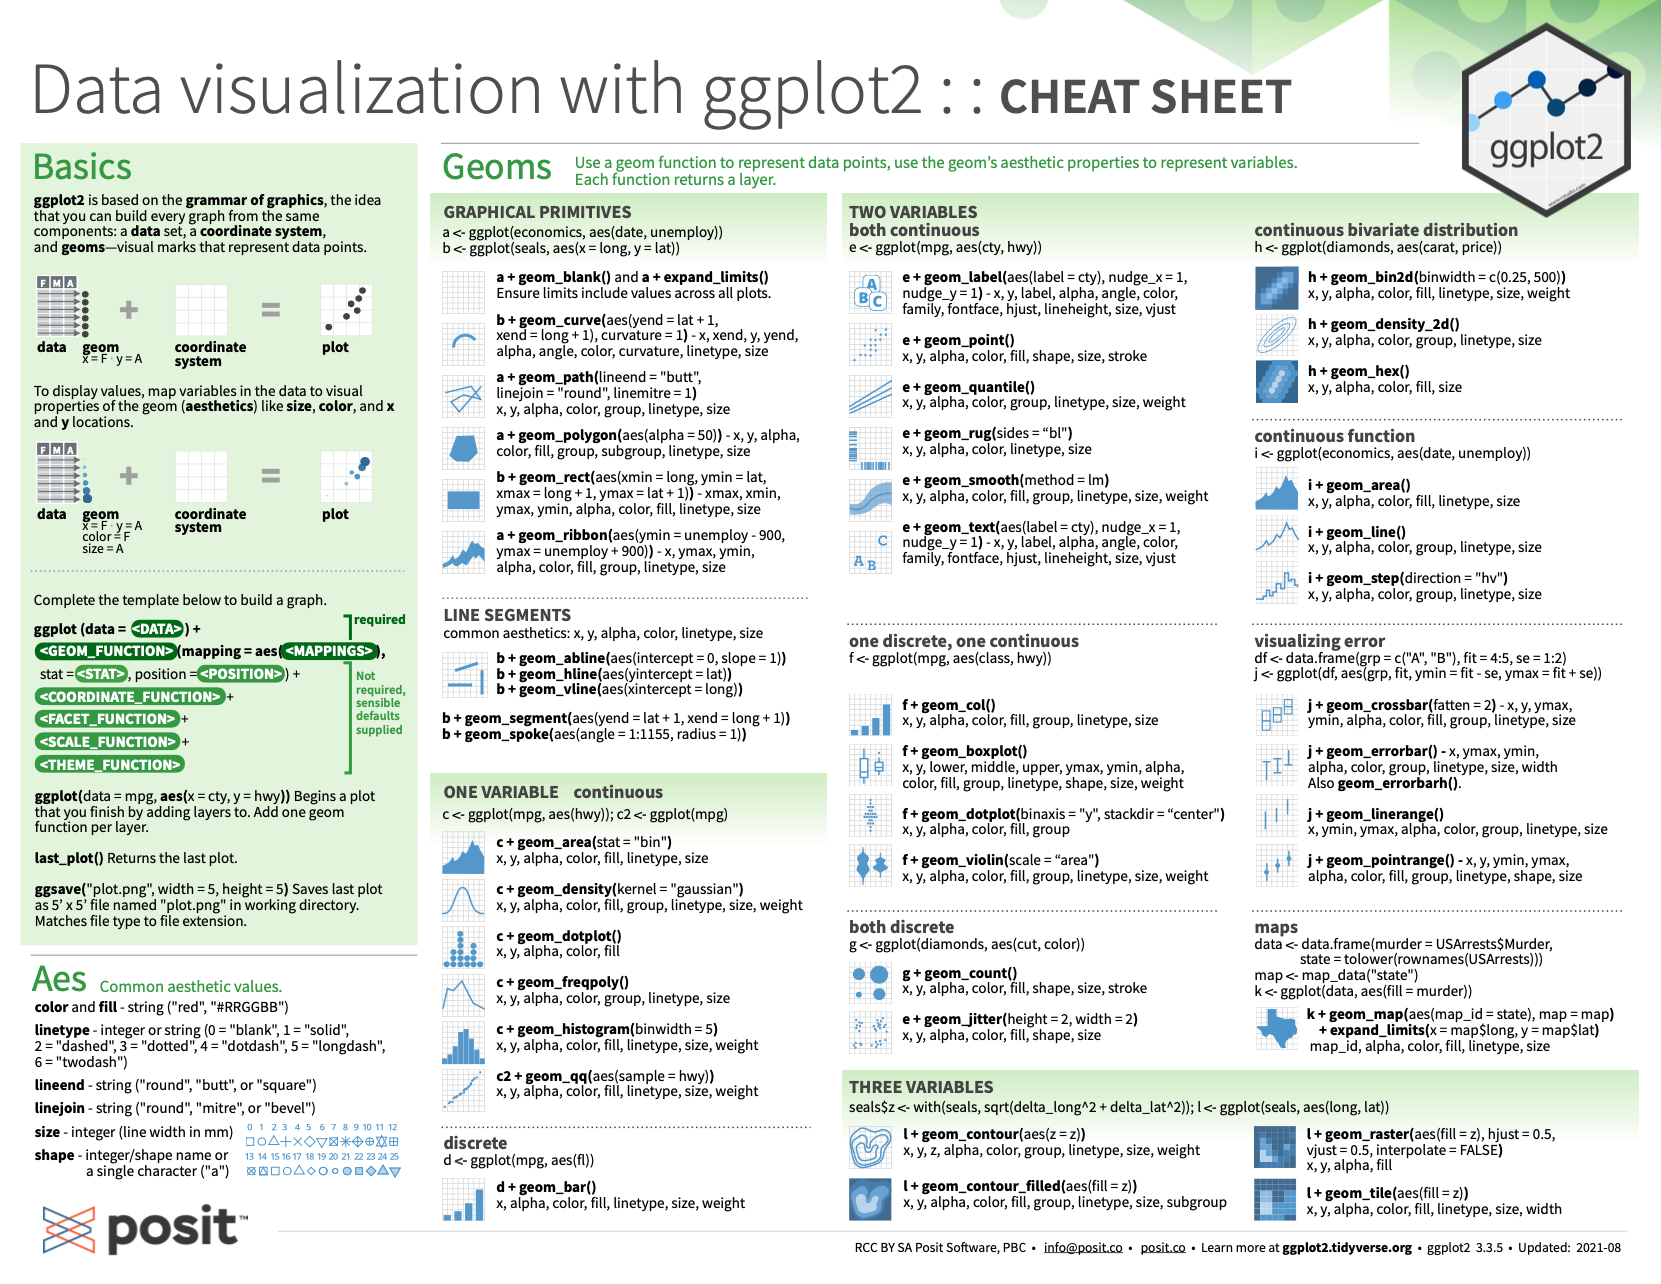
Figure 2.7: Data visualization with ggplot2 summary from RStudio cheatsheets.
Let’s test our knowledge and skills by completing the following exercises.