12.5 Understanding ASHA Positioning and Access via Dai comparison
- liminality in quant data
### Positioning: Influencers show how ASHA is a connector between systems
The next two figures illustrate the nature of ASHA’s positioning via her influence on (and cognitive association with) a number of behaviors. These quantify her statistical effect, as outlined in Chapter 8. While the figures contain a lot of information, a rather nuanced picture emerges when comparing them.
Figure 12.2 shows ASHA positioning with respect to biomedically impactful behaviors and Figure 12.3 shows ASHA positioning with respect to neutral behaviors. In both cases, the influencers associated with high probabilities of doing the behavior are to the left and with low probabilities of doing the behavior are to the right. An orange box in each row highlights the largest probability for that behavior, hence the strongest positive influencer, and a blue box the lowest probability for the most negative influencer. For the biomedical behaviors in Figure 12.2 we see that the ASHA is always to the left, high influence part of the Figure. She often has the highest positive influence (orange squares) and in that sense is part of the medical system by strength of impact. Sources that we might think of as being closer or more personal to the Mothers are always to the right, toward lower influence of the ASHA. So friends/relatives/neighbors, family, the RMP, the category of ‘no one,’ and the Dai are all mostly the negative or lowest influencers for health behavior.
For the neutral behaviors in Figure 12.3 we see that the ASHA is in the middle, positioned between medical influencers and personal or household influencers, showing her state as a connector. The ASHA has a lowering effect on the probability that Mothers call a Dai for delivery. It is possible that the ASHA and Dai complete a little over this service. Both receive incentives and there has been a large shift in time away from home delivery (Dai’s domain) and toward institutional delivery (ASHA’s domain).
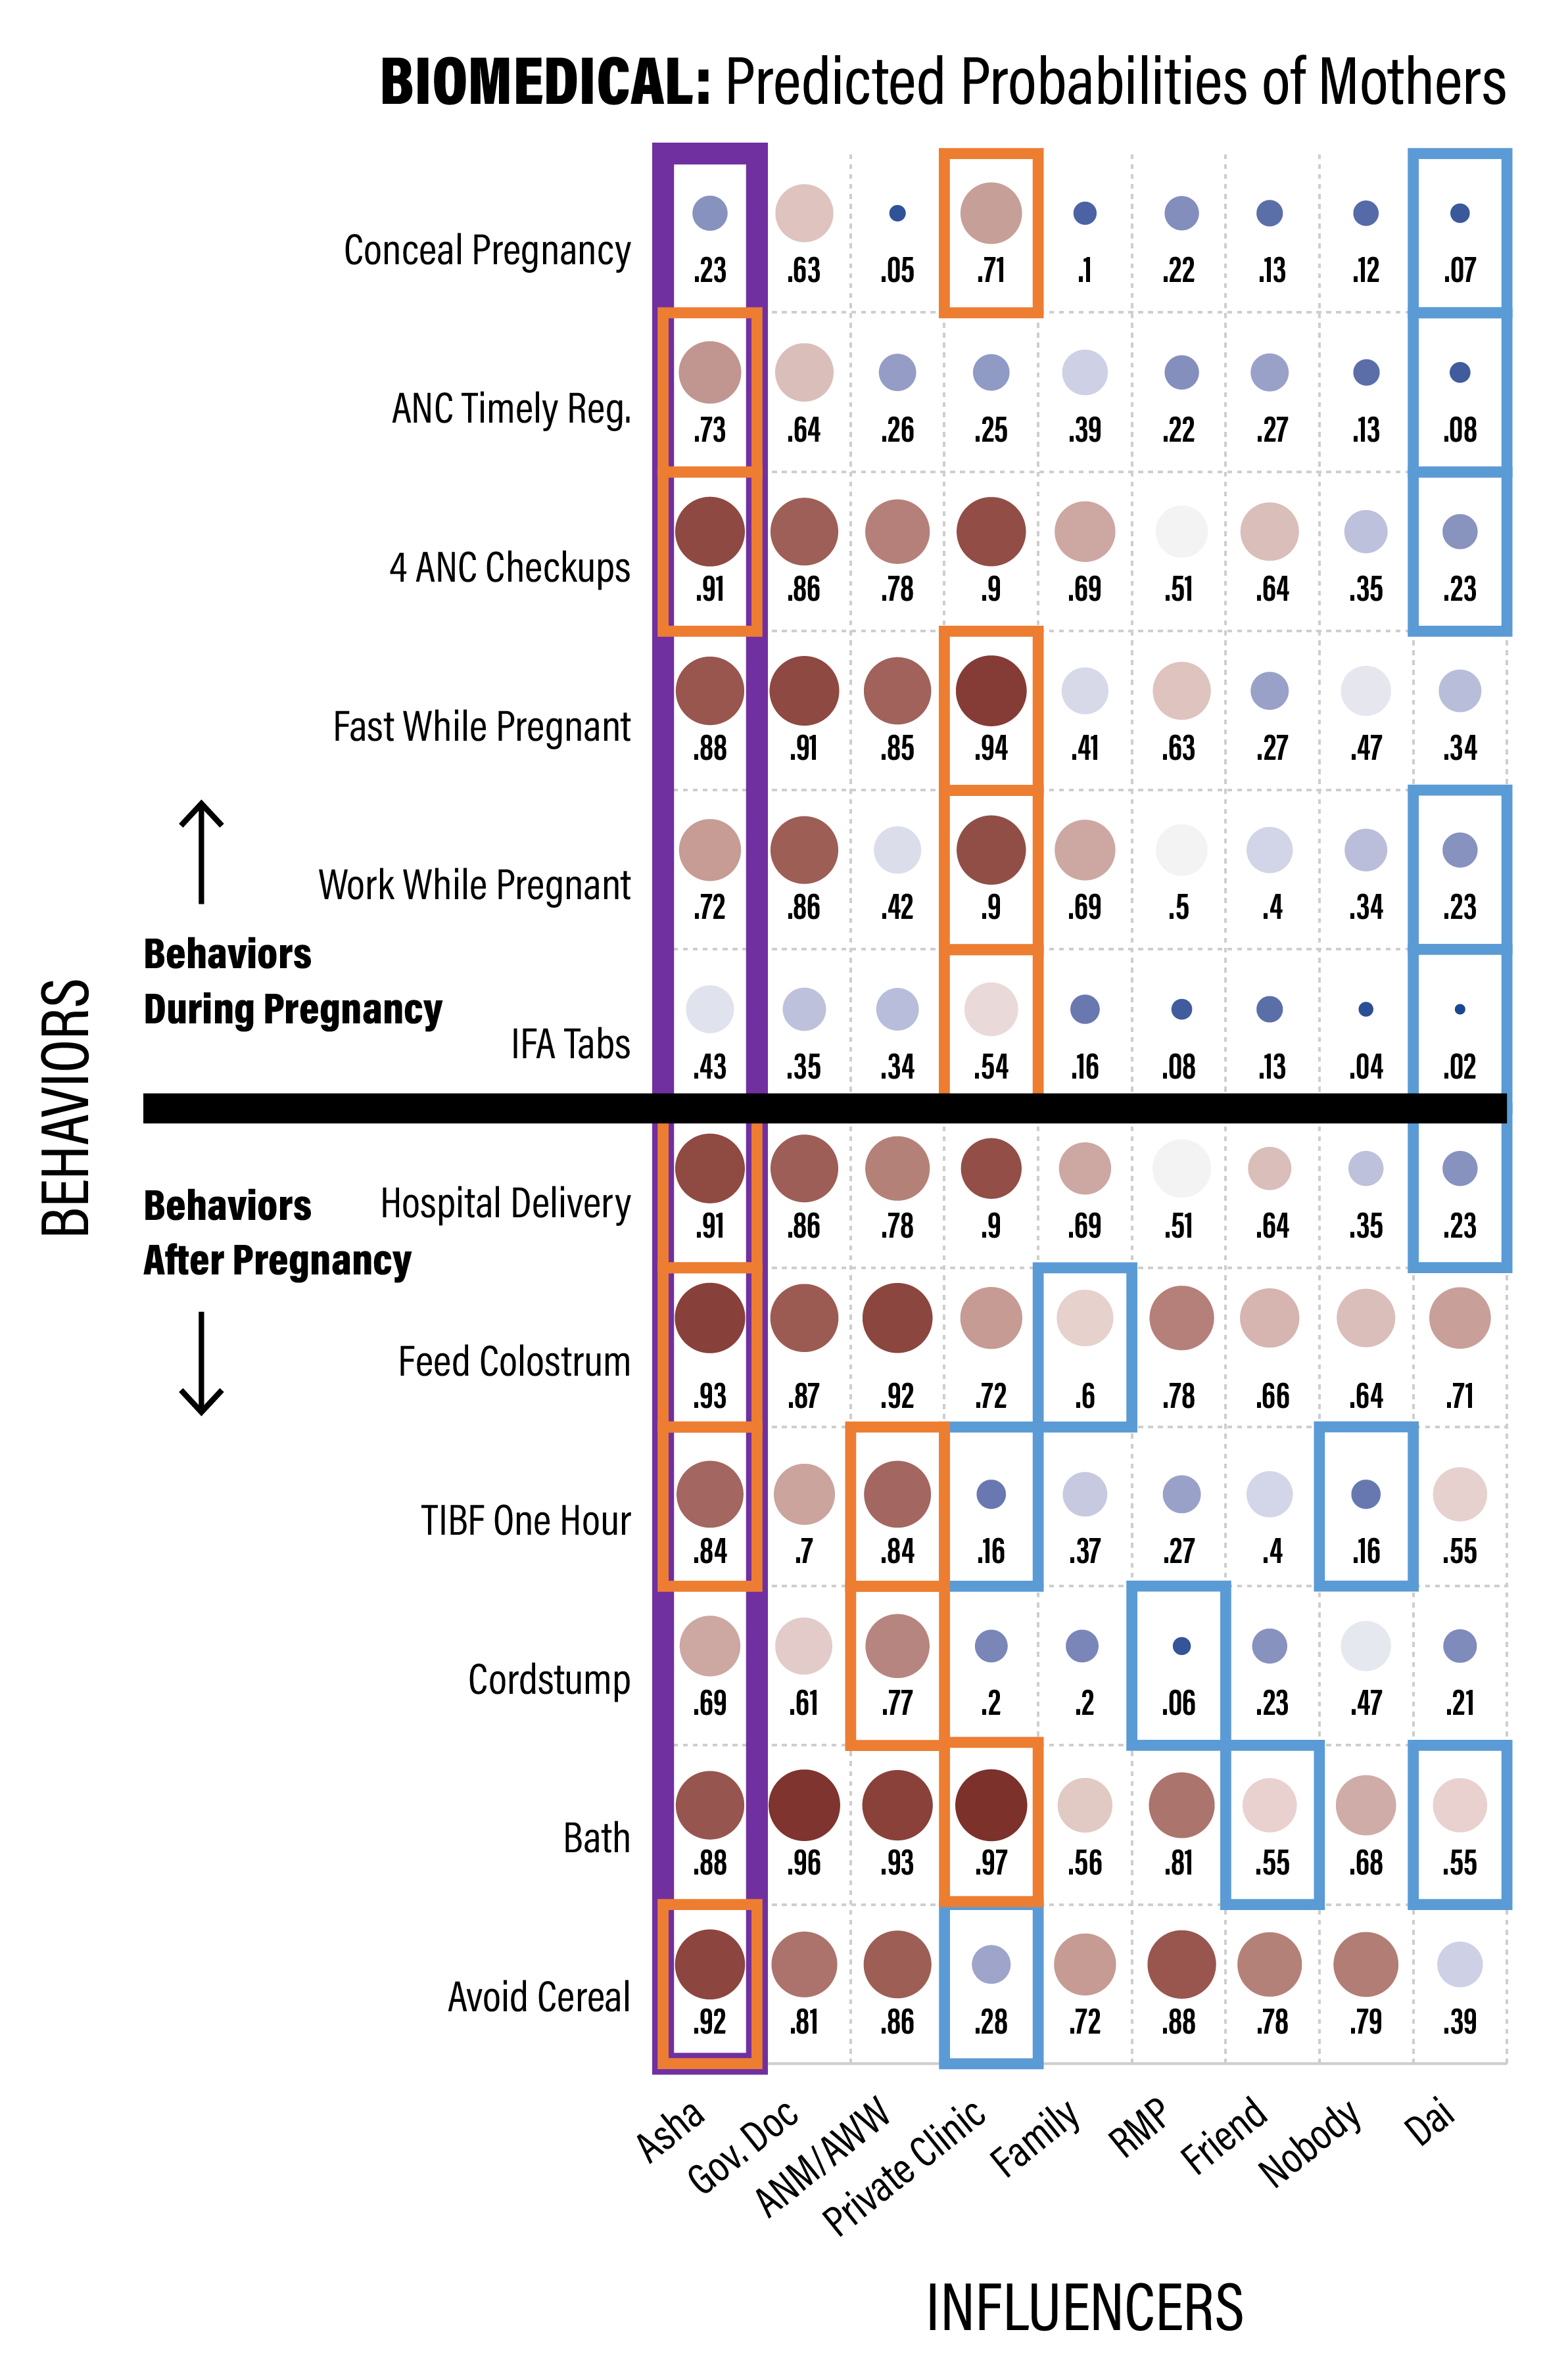
Figure 12.2: ASHA positioning as an influencer of biomedical behaviors for recent mothers. The red squares toward the left are around the largest value for each row, indicating the strongest positive influencer for that behavior, and the blue squares are for the lowest value for each row, indicating the lowest influencer for that behavior.
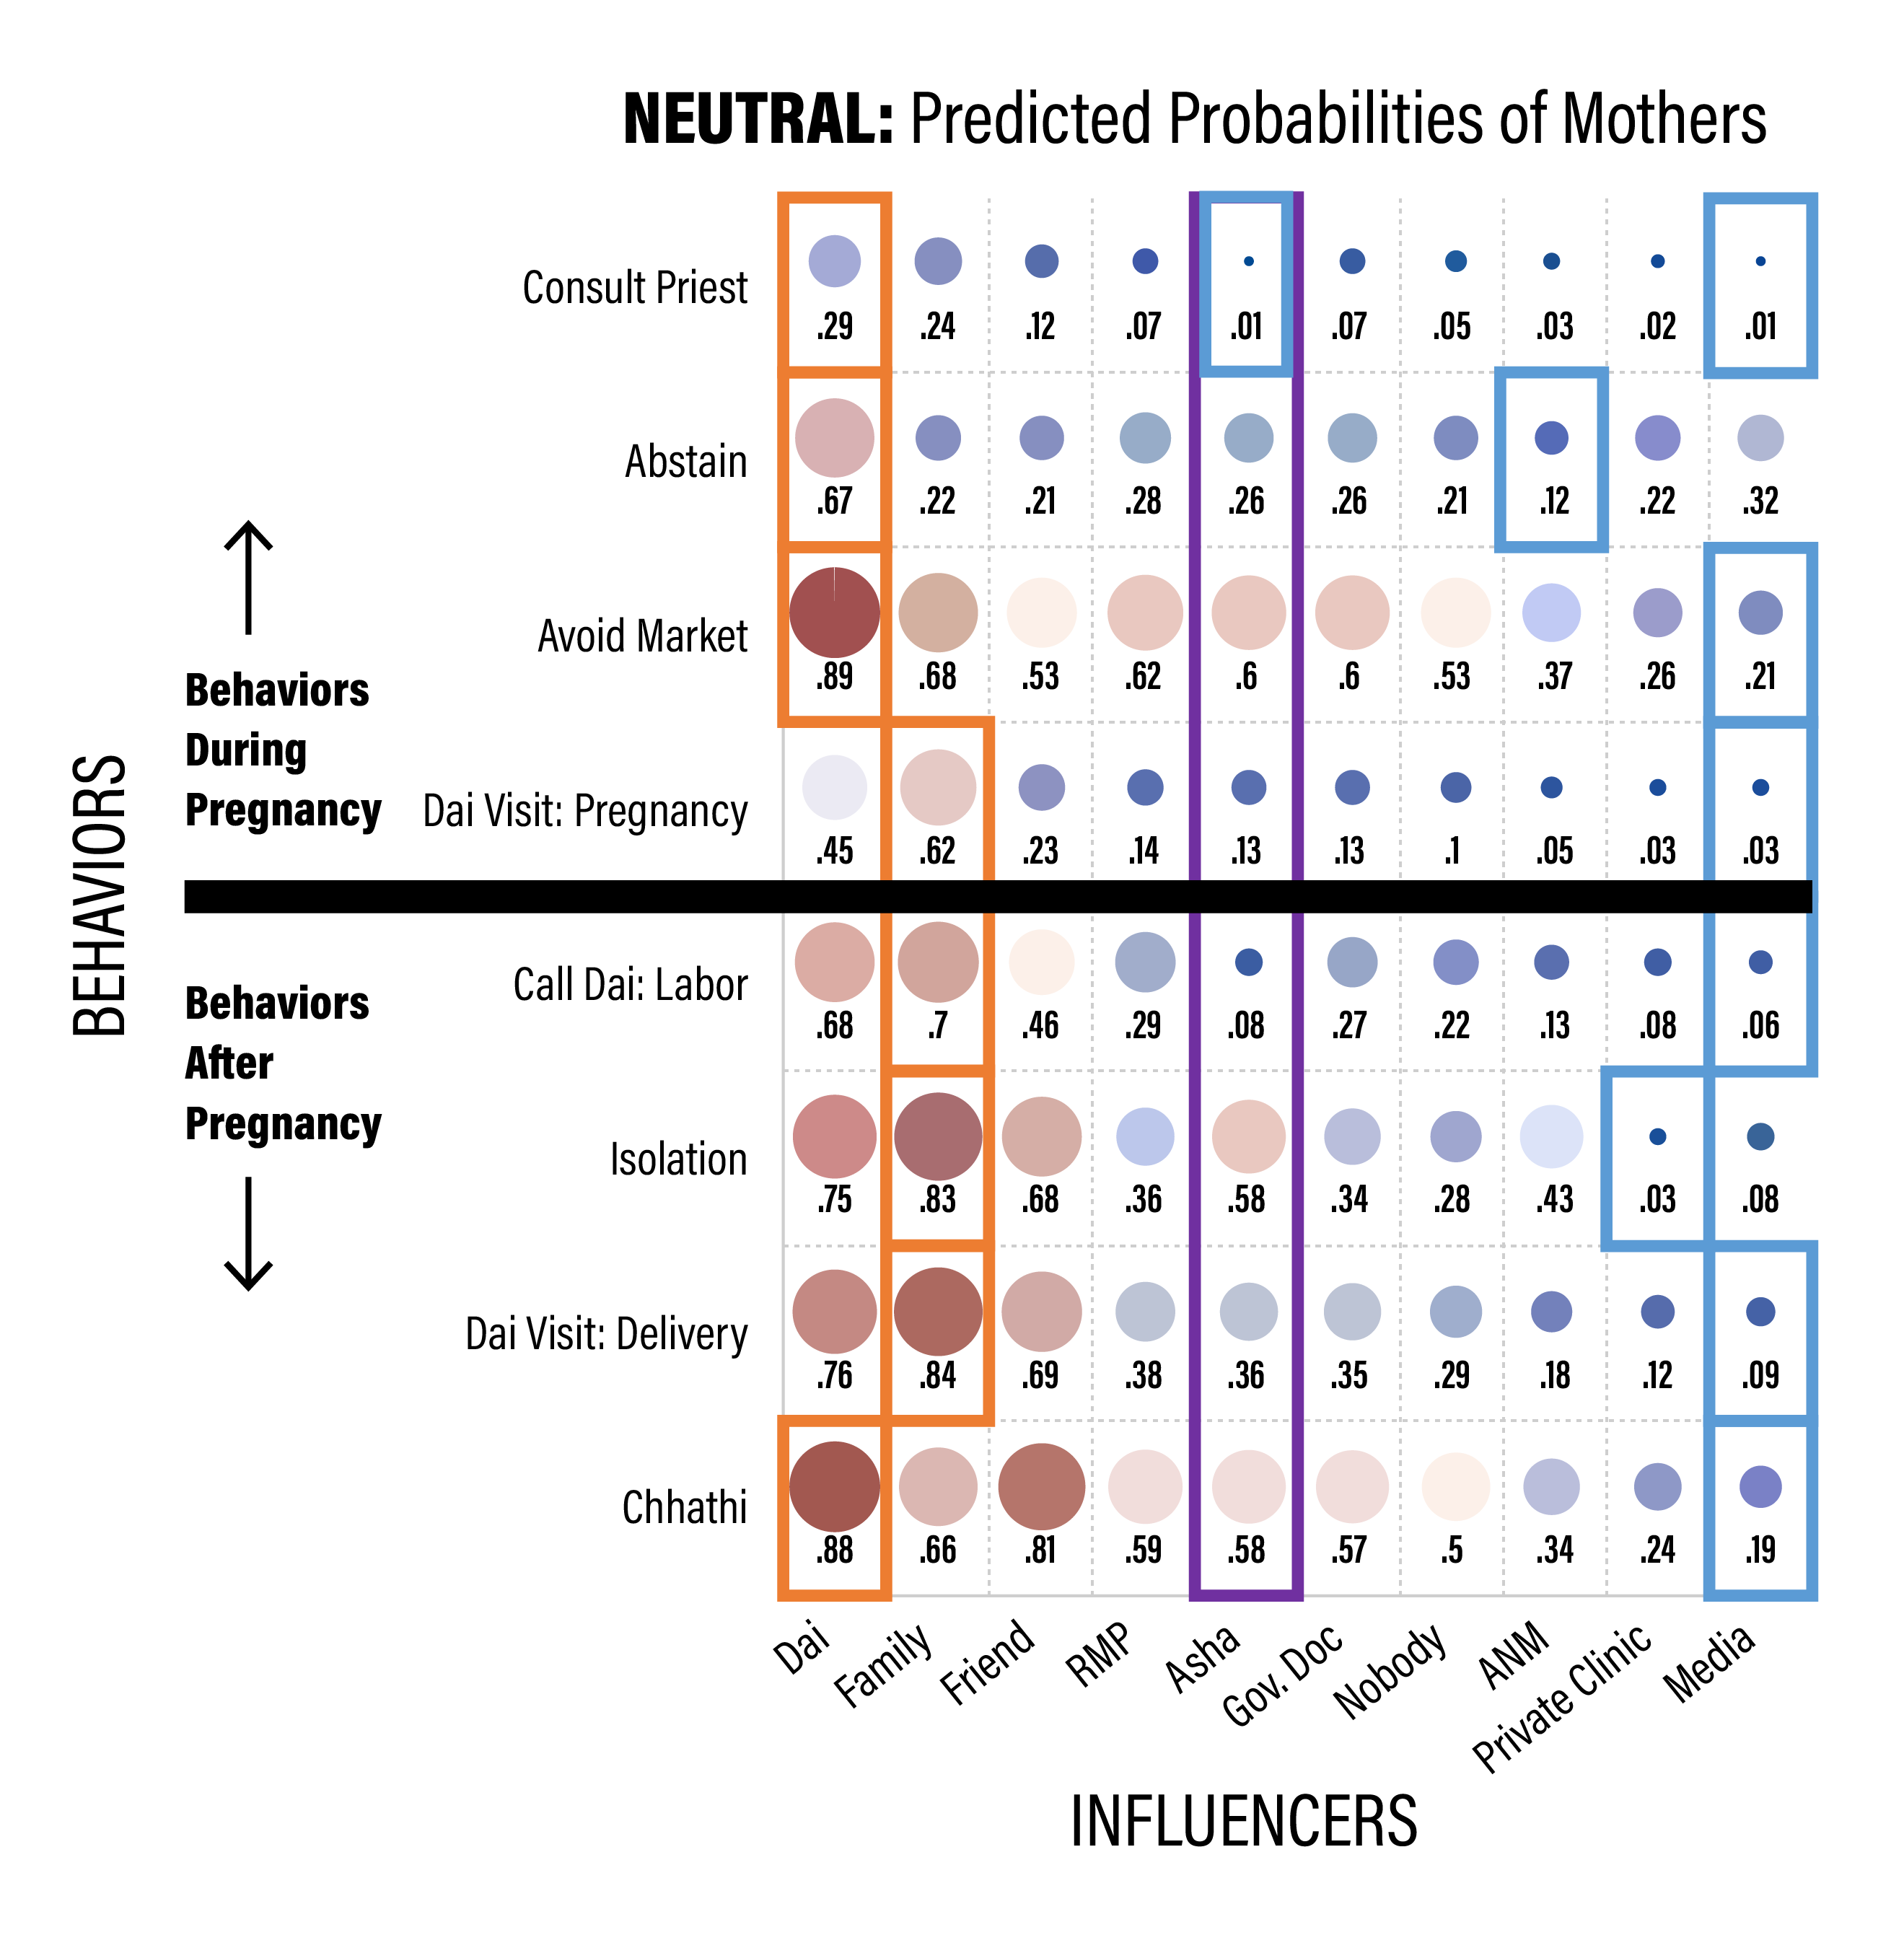
Figure 12.3: ASHA positioning as an influencer of neutral behaviors for recent mothers. The red squares toward the left are around the largest value for each row, indicating the strongest positive influencer for that behavior, and the blue squares are for the lowest value for each row, indicating the lowest influencer for that behavior.
connectedness Figure
IFA example