7.4 An ASHA Interaction Score
In Chapter 3 we summarized how ASHAs and community members perceive ASHA-beneficiary interactions, finding highly positive perceptions of the ASHA by the community and that the ASHA feels her work is appreciated. Here we take a first look at quantifying what the effects of those interactions might be for the uptake of health behaviors based on self-reports from the beneficiaries themselves.
To facilitate this, we computed a simple metric that captures the depth and breadth of how ASHAs interact with Mothers. This ASHA interaction score is a summation of several questions that either count a number of ASHA interactions or name the ASHA as facilitating access to a key service. For instance, one point is assigned for each home visit the ASHA makes during pregnancy, one point for instances when mothers say the ASHA helped them accomplish something like getting money or with a service or immunization. The questions that are summed up to determine the ASHA interaction score are listed in Table 7.6.
Summing these responses yielded a score that varies from zero to 74 with a median of 9 (see Figure 7.9 for histogram). The largest three values, 74 and two at 60, were somewhat difficult to believe and all three resulted from individuals who claimed to have been visited 20 and 30 times in the second and third trimesters. While this isn’t impossible, those three extreme values will be removed from analysis. It is likely that these cases exceptionally high interaction scores are women who live next door to an ASHA, or mothers who have an ASHA in the near family, which yielded frequent visits.
This ASHA interaction score will be used in some of the regressions presented below as a means to evaluate the impact of ASHA interaction on self-reported health behaviors.
| question | count |
|---|---|
| Q220 When you were pregnant, did asha come to your home to meet you anytime during the pregnancy? | 942 |
| Q221 At any time during the pregnancy, did asha ever come to your home to talk to you/ family members about you or your baby’s health? | 919 |
| Q243C In case of institutional delivery, did asha accompany you to the hospital? | 782 |
| Q301A1A Who provided you registration of pregnancy services?_ASHA | 768 |
| Q266 Did asha come to your home from hospital to drop you? | 631 |
| Q223 Besides these home visits, did you ever meet/had interaction with asha during your pregnancy? (health related interaction / outside home health related) | 542 |
| Q225 Did it ever happen that asha provided some health related advice for you to your relative (husband/mother in law etc)? OUTSIDE HOME | 457 |
| Q301E1A Who provided you services related to family planning-counselling home visits?_ASHA | 408 |
| Q242B12 If your last delivery happened in institution what were the reasons_ASHA’S SUPPORT | 240 |
| Q301F1A Who provided you filaria related services?_ASHA | 186 |
| Q301B1A Who provided you immunization services?_ASHA | 175 |
| Q301C1A Who provided you services related to newborn birh certificate?_ASHA | 148 |
| Q260I Did you receive any help from asha in getting this money? | 82 |
| Q205B11 If received 4 or more ANC’s, then why?_ASHA ENSURED/ACCOMPANIED | 55 |
| Q301G1A Who provided you malaria related services?_ASHA | 51 |
| Q207B9 If consumed 90 ifa tablets/3 syrup, why?_ASHA ENSURED THE AVAILABILITY | 39 |
| Q301D1A Who provided you services related to lbw identification/sam management?_ASHA | 39 |
| Q301H1A Who provided you services related to take home ration?_ASHA | 31 |
| N ASHA visits | Count |
|---|---|
| First trimester | |
| 0 | 402 |
| 1 | 341 |
| 2 | 112 |
| 3 | 41 |
| 4 | 11 |
| 5 | 9 |
| 6 | 1 |
| 7 | 1 |
| 8 | 1 |
| Second trimester | |
| 0 | 207 |
| 1 | 343 |
| 2 | 190 |
| 3 | 118 |
| 4 | 25 |
| 5 | 13 |
| 6 | 14 |
| 7 | 2 |
| 9 | 1 |
| 10 | 2 |
| 12 | 1 |
| 20 | 1 |
| 30 | 2 |
| Third trimester | |
| 0 | 160 |
| 1 | 315 |
| 2 | 216 |
| 3 | 136 |
| 4 | 37 |
| 5 | 21 |
| 6 | 18 |
| 7 | 6 |
| 8 | 1 |
| 9 | 2 |
| 10 | 3 |
| 12 | 1 |
| 15 | 1 |
| 20 | 1 |
| 30 | 1 |
| First week postpartum | |
| 0 | 615 |
| 1 | 253 |
| 2 | 215 |
| 3 | 60 |
| 4 | 14 |
| 5 | 3 |
| 6 | 4 |
| 7 | 8 |
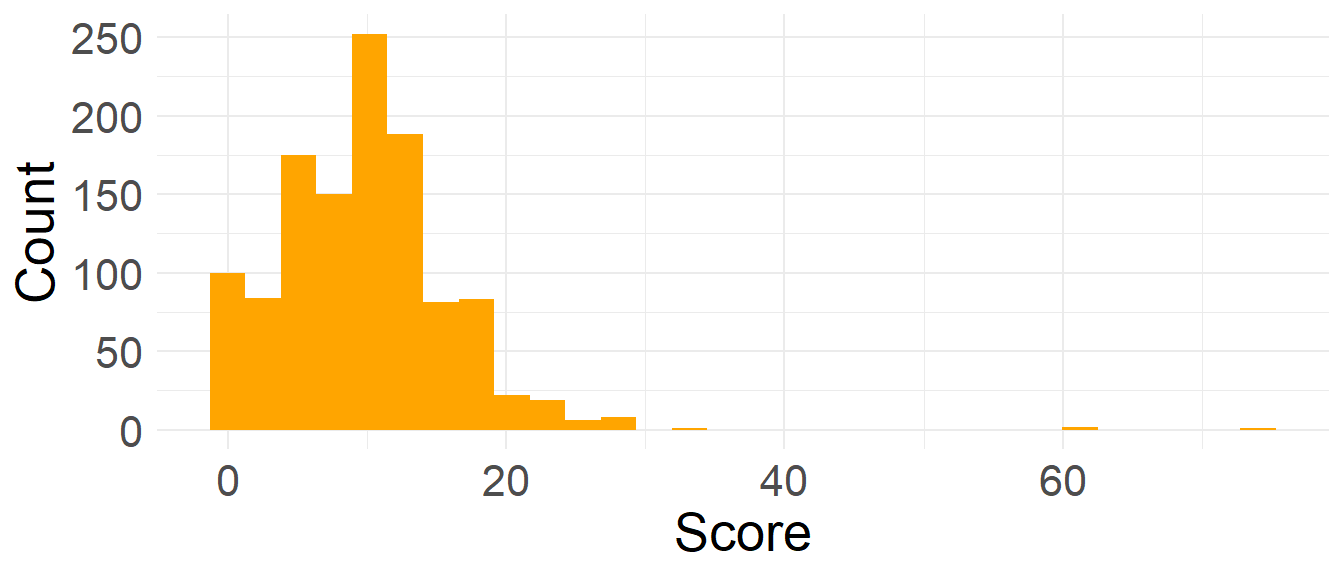
Figure 7.9: ASHA interaction score, histogram
Quite a few women did not receive a visit for the duration of a trimester (Table 7.6). Of the n_mom women surveyed, 253 (21.6%) did not receive an ASHA visit during pregnancy and 615 (52.5%) did not receive a postpartum visit (in the first week postpartum). Not surprisingly, the number of women going a full trimester without an ASHA visit decreases from the first to the third trimesters. Such infrequent postpartum visits from ASHAs may have significant impacts on the care given to the mother and her newborn baby, as the neonatal period (specially the first 7 days) is a time of increased risk for health complications and mortality. Likewise, with so many women receiving just one visit during pregnancy (13.1%), or no visits at all (22.3%), there is clearly room for improvement in this metric.
The survey also asks about other ways that ASHA can get messages to mothers. The first is by having a health relevant meeting outside of the household, and the second is sending a message via a family member. Of the 261 women who did not receive a visit during pregnancy, 156 13.3 also did not receive these other two kinds of visit (45 received advice via a relative and 81 met with the ASHA outside of the home). These remaining 156 represent a group that seems outside of the reach of the ASHA and we should wonder what selects for such a group.
7.4.1 Effects of ASHA Interaction on Perinatal Behaviors
Above, we introduced an ASHA interaction score. Here we run regressions on a handful of health-related perinatal behaviors that include the ASHA interaction score as a predictor. To avoid visual overload from taking in many regression tables, in the following table, each row is just for the ASHA interaction score coefficient from a different model fit. So rather than print the whole table for each regression, we make a table of just the row that has to do with this score and make a table of those.
| Modeled.behavior | expEst | Est | StdError | Pval |
|---|---|---|---|---|
| Birthloc_Gov | 1.218 | 0.197 | 0.019 | 0.00000 |
| Birthloc_Priv | 1.022 | 0.021 | 0.025 | 0.39772 |
| ANC_Late | 0.934 | -0.068 | 0.012 | 0.00000 |
| ANC_No | 0.624 | -0.471 | 0.079 | 0.00000 |
| IFAtabs | 1.070 | 0.068 | 0.011 | 0.00000 |
| Colostrum | 1.040 | 0.040 | 0.014 | 0.00500 |
| TIBF | 1.110 | 0.105 | 0.012 | 0.00000 |
| Work_while_preg | 0.965 | -0.035 | 0.011 | 0.00100 |
| Fast_while_preg | 0.978 | -0.022 | 0.010 | 0.02100 |
| NewbornBath | 0.958 | -0.043 | 0.011 | 0.00000 |
In the above table the overall result is that women who engage with ASHAs more often are also significantly more likely to self-report that they have adopted biomedically desirable behaviors.
A line-by-line breakdown of the table is: Women with higher interactions scores were…
about 22% more likely to give birth in a government hospital and slightly more likely to give birth in a private hospital (both relative to a home birth)
much less likely to not do an ANC registration and a little less likely to register late.
more likely to take IFA tablets (by about 1.2% per 1 unit increase in ASHA Interaction Score)
more likely to have fed colostrum
more likely to have begun breast feeding in a timely manner
less likely to have done heavy work while pregnant
less likely to have fasted while pregnant
less likely to have bathed their newborn within 24 hours of giving birth
Most of the effects are small but keep in mind that they are per unit increase in the ASHA interaction score. So a value of 1.004 of an odds ratio for Colostrum means that for each increase of 1 in the ASHA interaction score, the odds of having fed colostrum increase by 0.4%.