8.2 Influencer Counts/Percentages
First, we look at associations between behaviors and influencers. We think of these as “mentions” in that they are the percent of times each influencer was mentioned as associated with a behavior (the values after mentions are called “effects” because they are the actual statistical effect of doing the behavior given each source of influence).
8.2.1 How to Interpret These Figures
In the following figures, the names of each behavior are abbreviated on the y-axis, please refer to Table 7.1 from the previous chapter for a full description linking each abbreviated name to the original question from the survey and any additional coding that was needed.
The bottom (x-axis) of the figure shows the influencer categories arranged from left to right according to how often each is named on average in each sample. This means the order of the labels for the influencer categories can change for each figure.
The cells are shaded by the magnitude of the value in each one such that greater percentages are in red and lower percentages are in blue.
The ASHA version of the figure is about the ASHA’s most recent birth. Recall from Chapter 6 (Figure 6.4), that the time to last birth is generally longer and also is quite variable among ASHAs but is within a maximum of the previous six months for Mothers.
The percentages are reported in three ways. The first is total mentions, which means every time an influencer is associated with a behavior. After total mentions, the responses are subset by percent who did the behavior and the percent who did NOT do the behavior. Importantly, women can name multiple influencers per question so the percentages are the percent of total mentions, not the percentage of women who named the influencer (the reason for this is to have percentages that sum to 100 as that makes them easier to interpret).
In comparing the order of influencers on each figure, both Mothers and ASHAs commonly state family (which includes husband, mother-in-law, and other family), along with “no one” and the “friends, relatives, and neighbors.” ASHAs are named much less often as influencers by ASHAs themselves, but this is probably because most of the ASHAs did not have an ASHA for their last delivery (again, time-to-last-birth is generally much longer for ASHAs than for Mothers, see Figure 6.4).
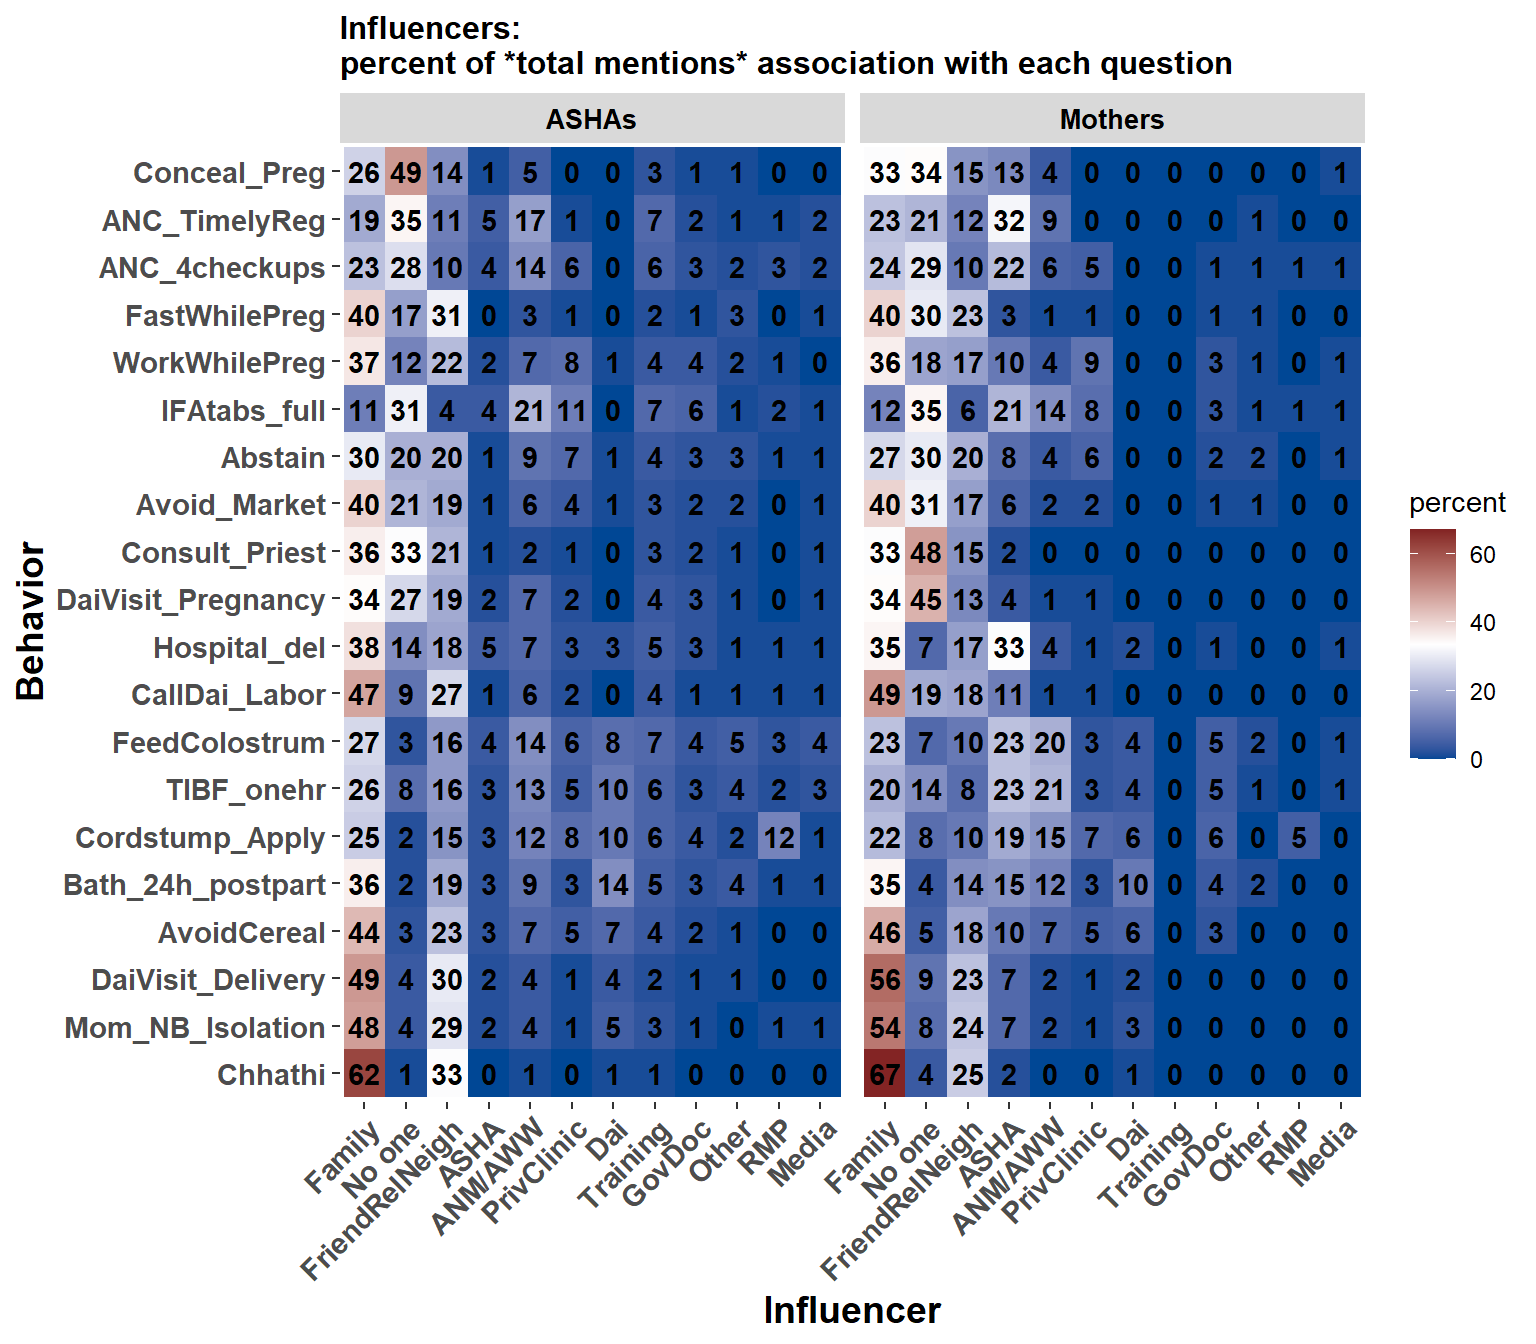
The behaviors on the y-axis are grouped such that biomedically recommended behaviors are at the top, neutral behaviors are in the middle, and biomedically not-recommended behaviors are at the bottom. From looking across the percentages for each behavior/influencer combination one thing that jumps out is that some behaviors are associated with many influencers while others are associated with vary few. For example, the ASHA data is in the left panel and we see that Chhathi was associated with Family 62% of the time and Friends/relatives/neighbors 33% of the time and all the other influencers are 1 or 0%. Applying a substance to the cordstump and bathing the newborn postpartum both have some association with every influencer category.
8.2.2 Influencers, percent association for each behavior

Figure 8.1: The percentage of times each influencer was named for each behavior. The number in each cell is a percentage. The influencers are ordered from most- (left) to least- (right) often named. Behaviors are ordered with desirable behaviors at the top, neutral behaviors in the middle, and undesirble near bottom.

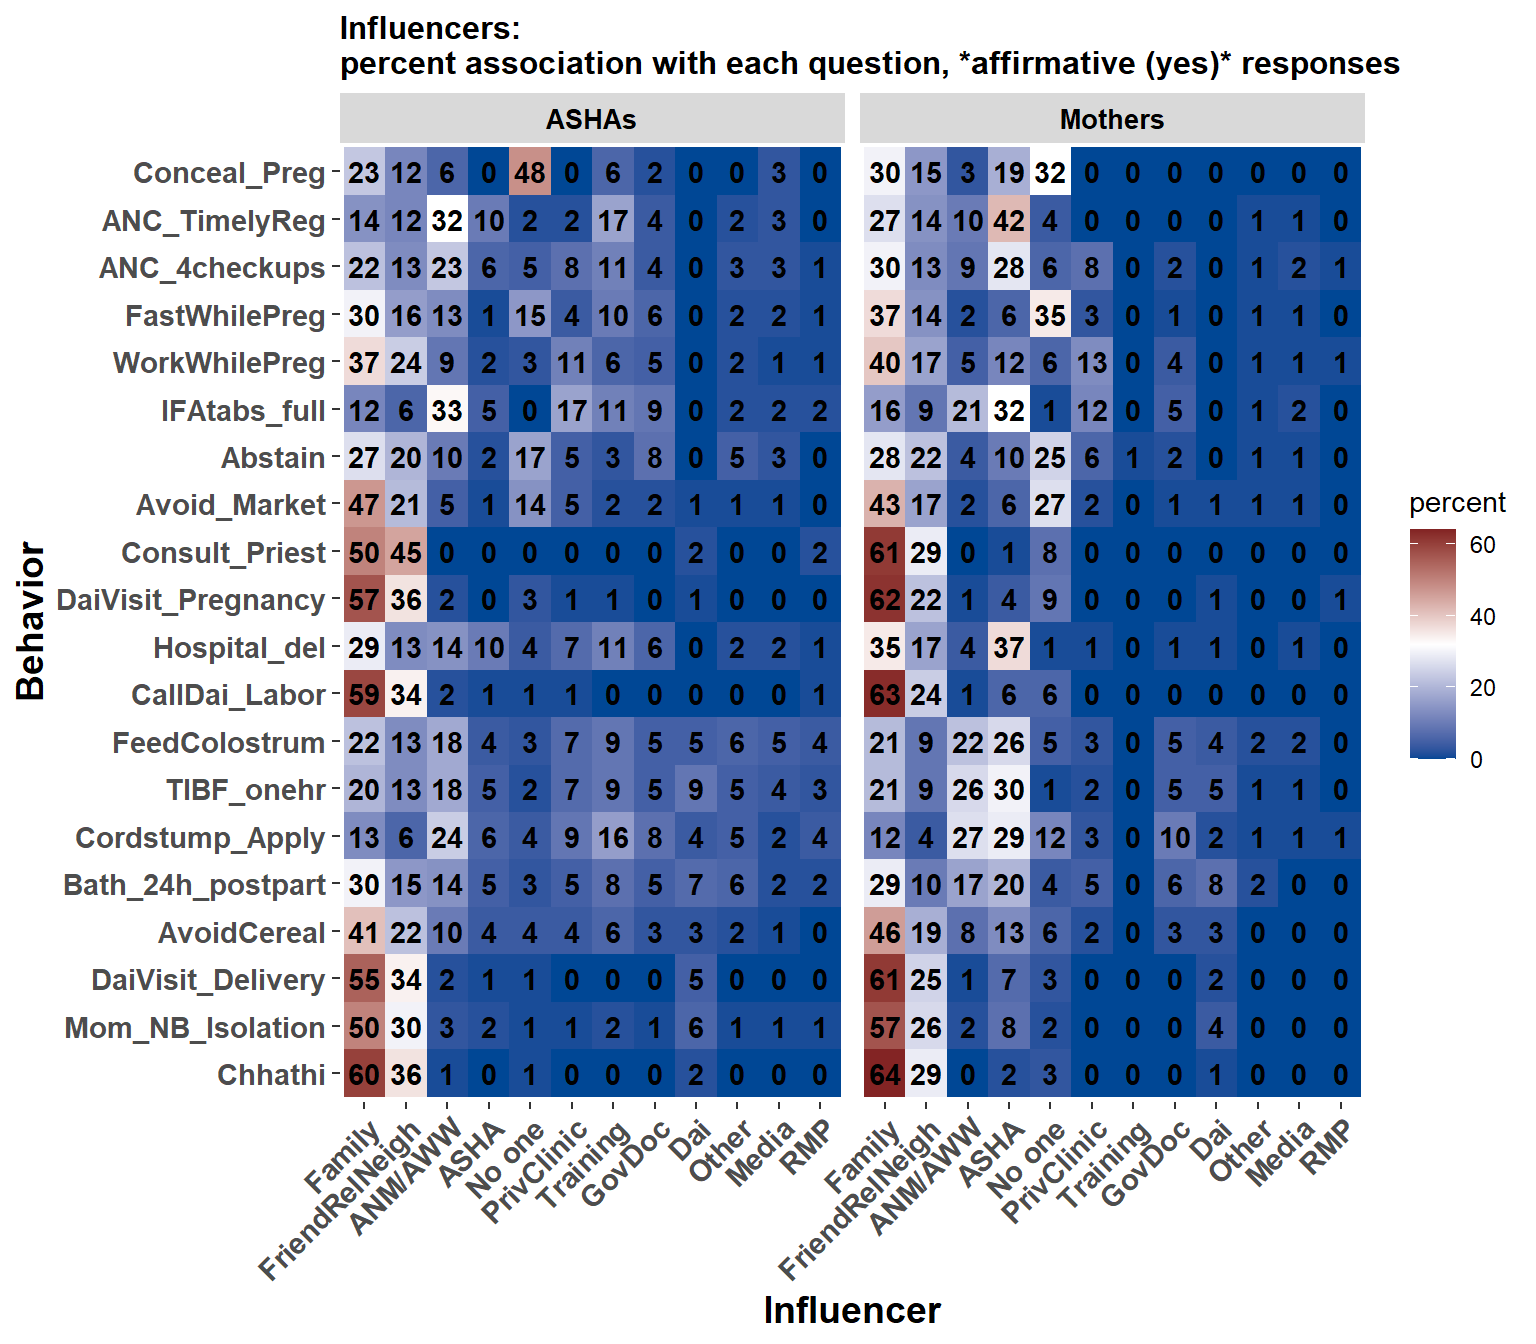
Figure 8.2: The percentage of times each influencer was named for each behavior. The number in each cell is a percentage. The influencers are ordered from most- (left) to least- (right) often named. Behaviors are ordered with desirable behaviors at the top, neutral behaviors in the middle, and undesirble near bottom.

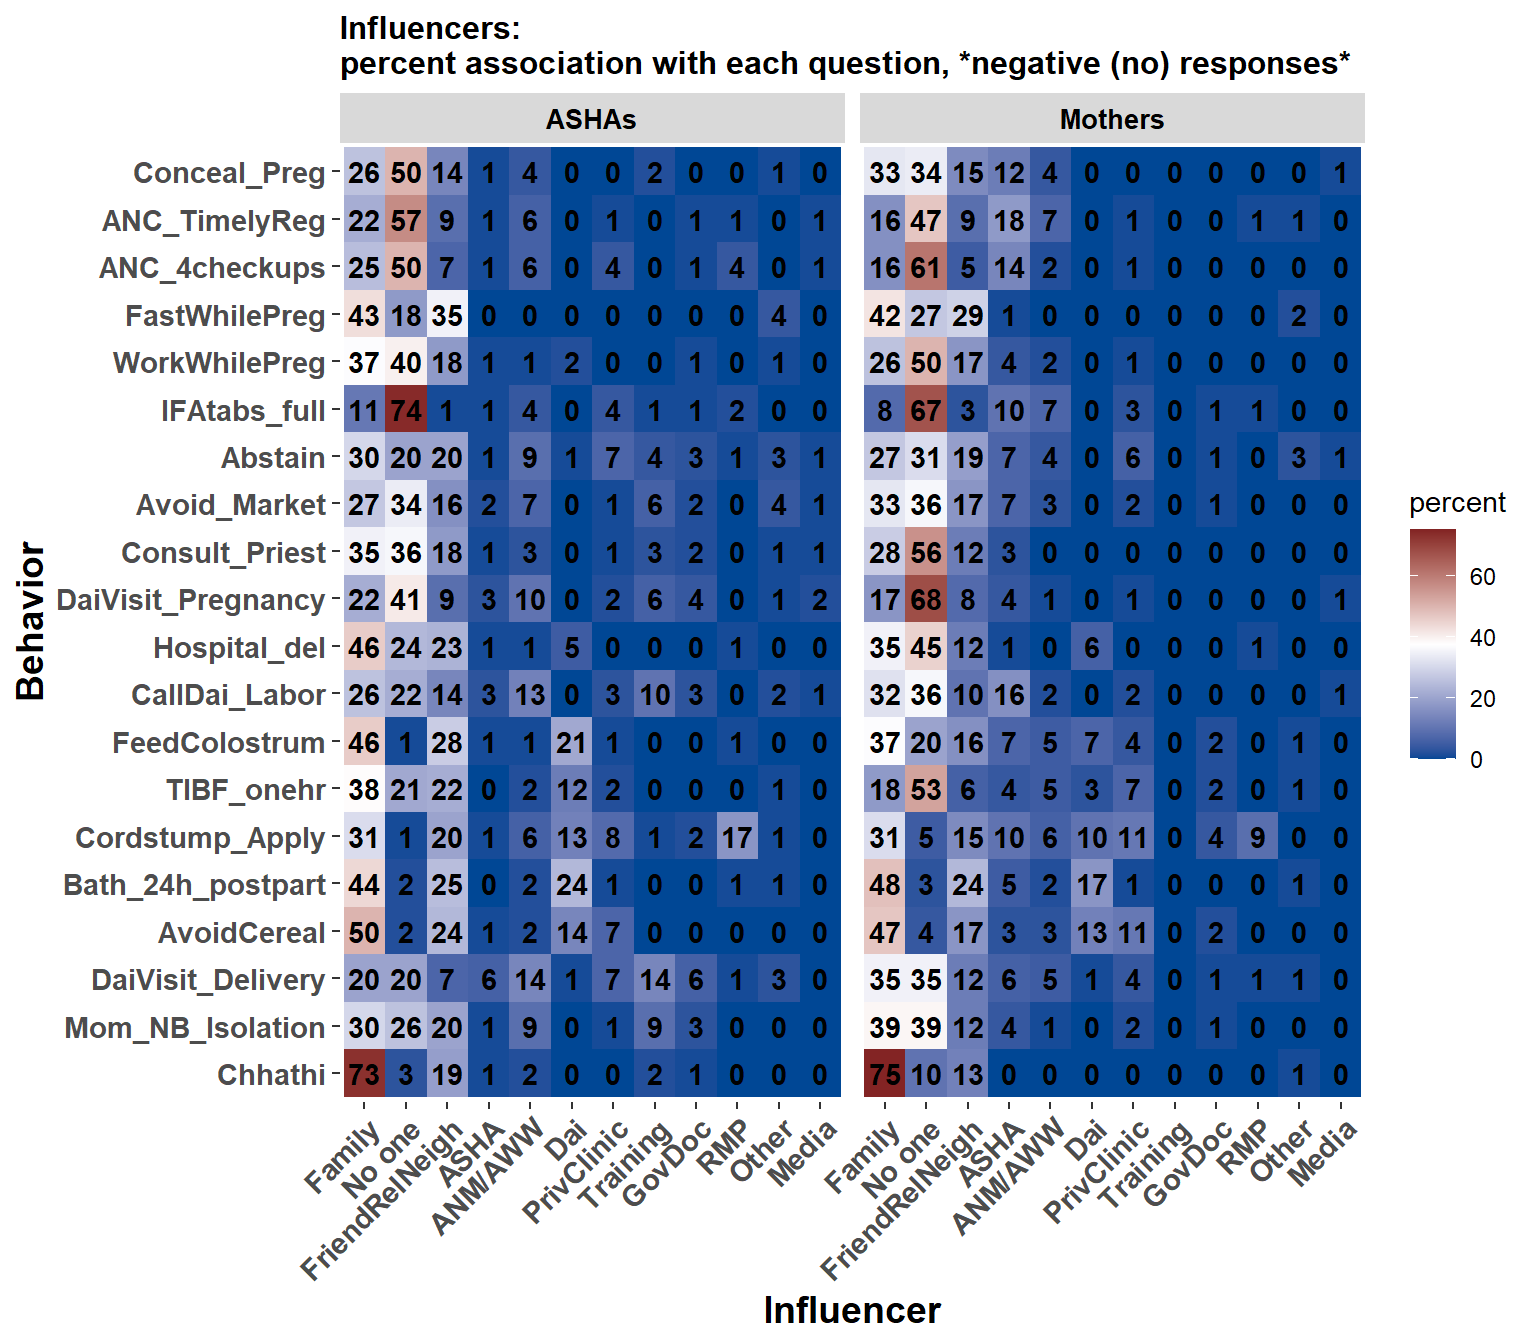
Figure 8.3: The percentage of times each influencer was named for each behavior. The number in each cell is a percentage. The influencers are ordered from most- (left) to least- (right) often named. Behaviors are ordered with desirable behaviors at the top, neutral behaviors in the middle, and undesirble near bottom.
In the the total mentions figure we see that a few associations jump out as matching our likely intuition about who influences each behavior. For instance, Chhathi is almost completely associated with Family or Friends/relatives/neighbors among both ASHAs and Mothers. The RMP is rarely mentioned in both samples but is much more often associated with behaviors by at least a few ASHAs than mothers (e.g., the number of cells with zero is much more in the Mother data than the ASHA).
In the next pair of figures these associations are separated into ‘yes’ and ‘no’ responses. Here we again note some findings that seem intuitive. Many more Mothers than ASHAs associate the ASHA with hospital delivery. Likewise, Mothers who did not have a hospital delivery hardly mention the ASHA as a source of influence (1% of mentions), but ASHAs are over a third of mentions for Mothers who did have a hospital delivery.
After summarizing the ‘other’ category, we turn to the actual impact of these influencer categories on whether or not the mothers did the behavior or not.
8.2.3 The “other” influencer category
Each time a participant selects ‘other’ as an answer to ‘who told you?’ there is the option to write in the influence stated by the participant. We include these for the interested reader and to highlight the diversity of additional sources named. There are multiple instances of answers containing ‘book’ and a handful that contain ‘YouTube’ or ‘mobile.’
8.2.3.1 The top 25 “other” responses:
| Other influencer | n |
|---|---|
| Priest | 44 |
| Book | 41 |
| Mobile | 26 |
| Lived at mother’s home | 20 |
| Mamta | 18 |
| Feal hesitation | 12 |
| Did’t want child | 10 |
| Had gone out of home | 8 |
| Teacher | 8 |
| Mobile internet | 7 |
| To make mcp card | 7 |
| Family member not accompained | 6 |
| Due to strike | 5 |
| Mamta didi | 5 |
| Asha’s husband | 4 |
| Due to illness | 4 |
| Due to long distance | 4 |
| Due to strike on awc | 4 |
| Husband did not allow | 4 |
| To receive thr | 4 |
| Nurse | 3 |
| Poster | 3 |
| Quran | 3 |
| Youtube | 3 |
| “Menstrual cycle | 2 |
| Other influencer | n |
|---|---|
| Book | 59 |
| Priest | 26 |
| Mobile kunji | 19 |
| Mamta | 18 |
| Phc | 11 |
| Asha facilitator | 7 |
| Read in book | 6 |
| Hospital’s staff | 5 |
| Nurse | 5 |
| Poster | 5 |
| Asha book | 2 |
| Bcm | 2 |
| Biology book | 2 |
| For immunization | 2 |
| Friends | 2 |
| From teacher | 2 |
| Poster, book | 2 |
| Quran | 2 |
| Read in biology book | 2 |
| Advised by saint | 1 |
| Asha’s book, mobile kunji | 1 |
| Asha day meeting | 1 |
| Asha day meeting, book | 1 |
| Barber | 1 |
| Bhm | 1 |