6.3 Sample characteristics & ASHA-Mother comparison
Here we examine the demographic characteristics of the ASHAs and the mothers to whom they provide services. In doing this we acquaint the reader with general characteristics of these two sample populations, while also introducing the variables that are used repeatedly in the analyses that follow. We also begin to note some of the heterogeneity between and within these two groups of women.
The characteristics of the women in the Project RISE sample largely reflect a population that is in flux but where many international development outcomes are still lagging behind Millennium Development Goals. Nearly 100% of the mothers in this sample are married, with a modal age at marriage of 18 but varying from 10 to 27 6.2. About 10% were married between the ages of 12 and 14.
Just under half of the women we surveyed say they cannot read and write and 31% said their husbands cannot read and write. Almost 90% listed ‘housewife’ as their main occupation.
Total fertility ranged from 1 to 8 with a mean of 2.5, but note that because many of the mothers are young this is not completed fertility, but rather the number of births experienced by each woman at the time of the study.
ASHAs are members of the same communities, but tend to be an older and more educated subset of women than beneficiaries. ASHAs range in age from 23 to 65, with an average of about 38 years. As such they are partially overlapping with mothers but older on average. The fertility profile of ASHAs is more akin to a completed fertility distribution.
6.3.0.1 Age
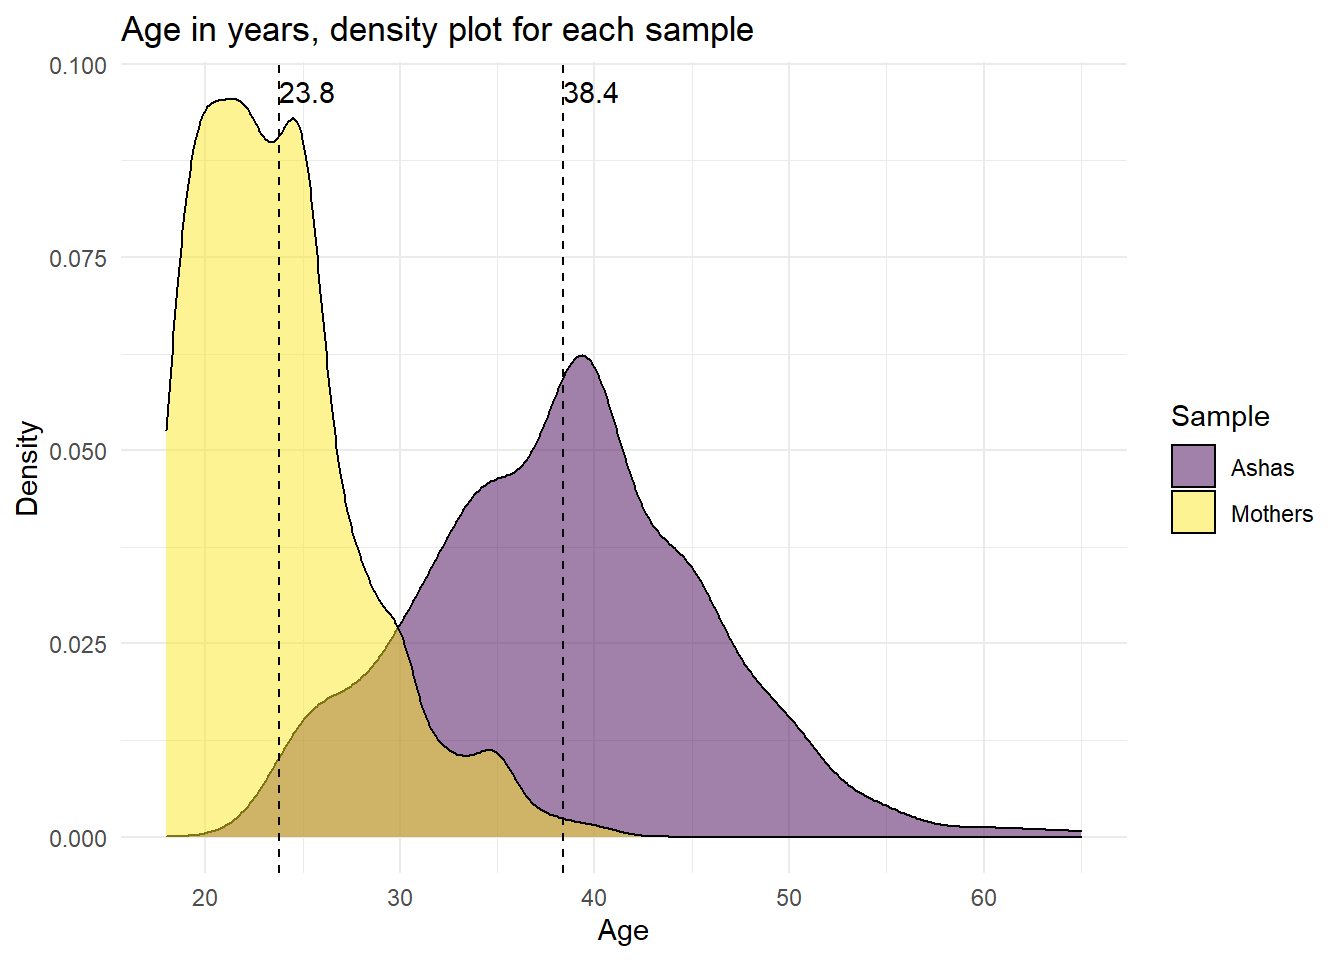
Figure 6.1: Age for each sample
| Sample | Mean_age | Min_age | Max_age |
|---|---|---|---|
| Ashas | 38.4 | 23 | 65 |
| Mothers | 23.8 | 18 | 41 |
While the age ranges have quite a bit of overlap, ASHAs are on average almost a full generation-length older than their beneficiaries. For Project RISE the age difference is noteworthy because:
- Some of the differences between ASHAs and their beneficiaries may be due to age rather than to a function of ASHA training or some of the other factors unique to ASHAs
- For some questions we can examine generational changes in perception or behavior
Age at marriage was asked of the recent mothers sample but not of the ASHAs.

Figure 6.2: Age at marriage, mothers
While the majority of recent mothers interviewed got married at about age 18, a few married as young as 10 years old, and about 1 in 4 by age 15; more than 2 in 5 women were married by 16 years of age.
6.3.0.2 Fertility
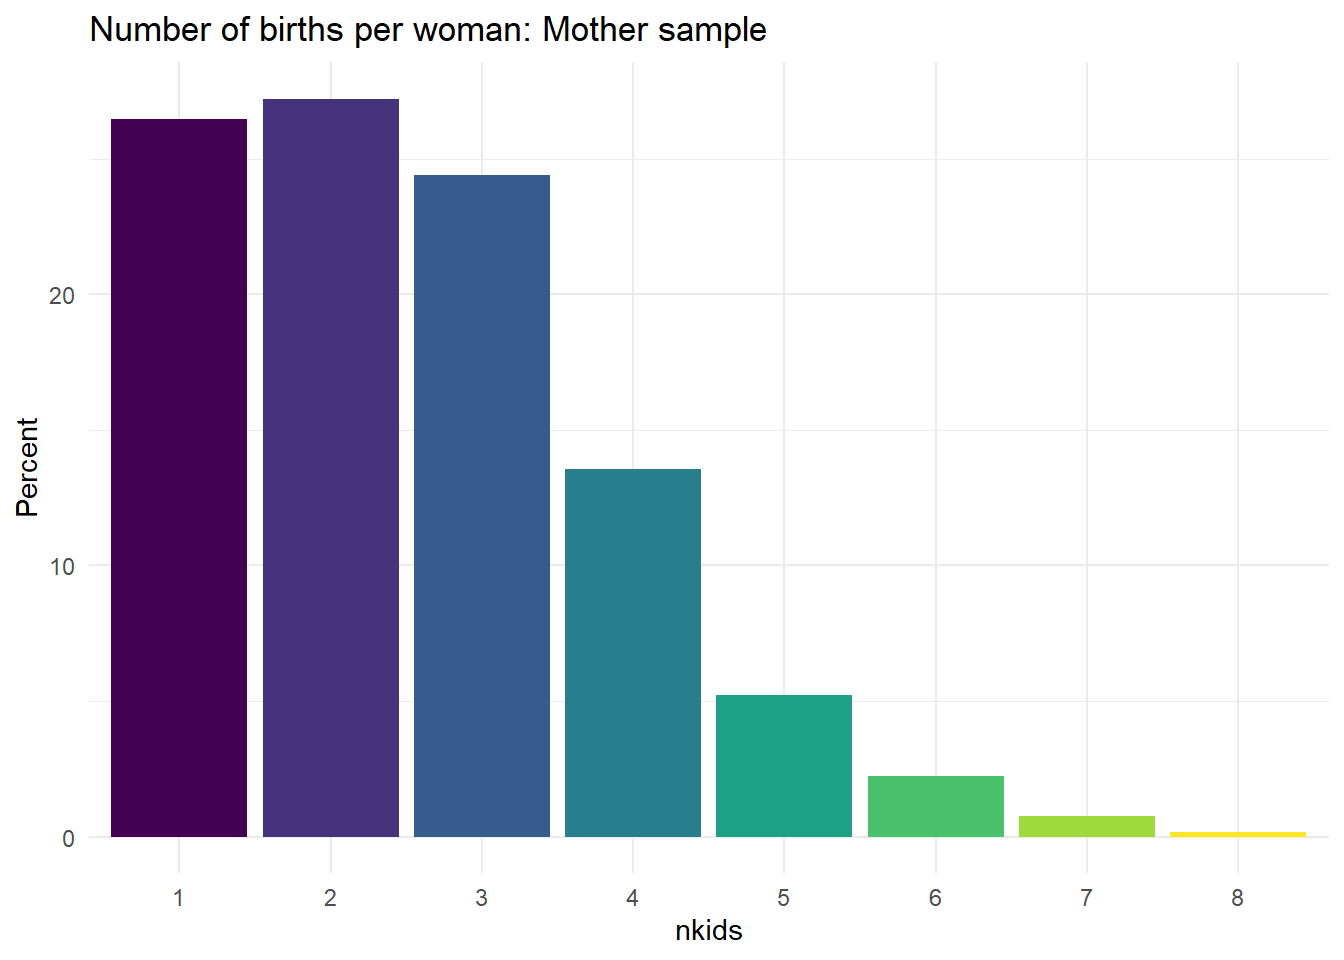
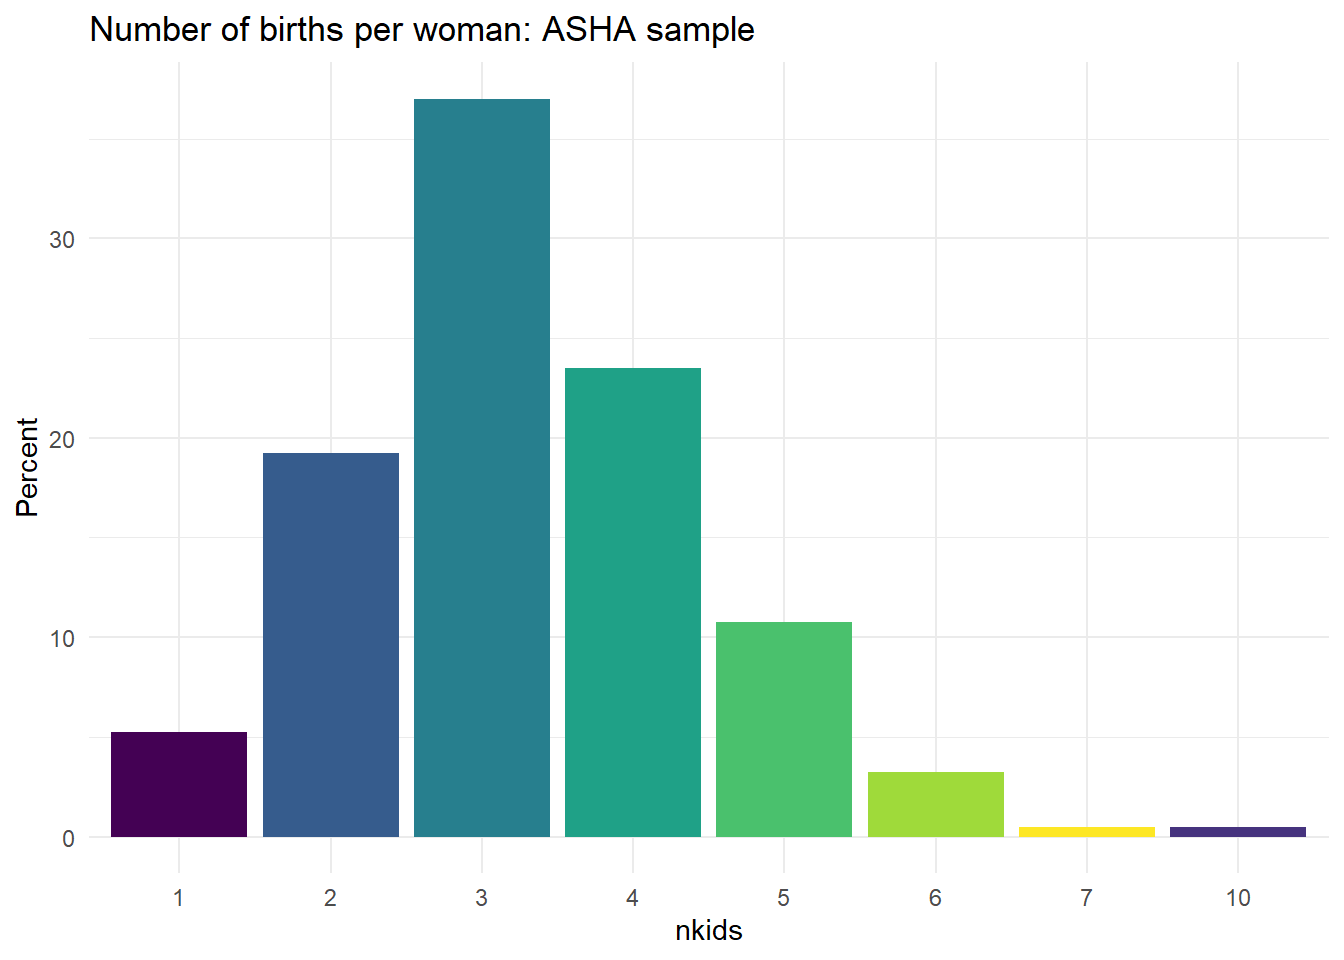
Figure 6.3: Total births for each sample
The two distributions for fertility look different primarily because of age. The most common values for the recent mothers are 1 and 2 children, but are 3 and 4 children for ASHAs because many of the mothers are at the beginning of their reproductive lifespans and most of the ASHAs have completed it. ASHAs have higher than average levels of education for their communities and yet still have fairly high fertility.
We ask many questions on the survey about each woman’s most recent birth. For this reason look at the typical amounts of time that has elapsed between the date of the survey and the the most recent birth (Figure 6.4).
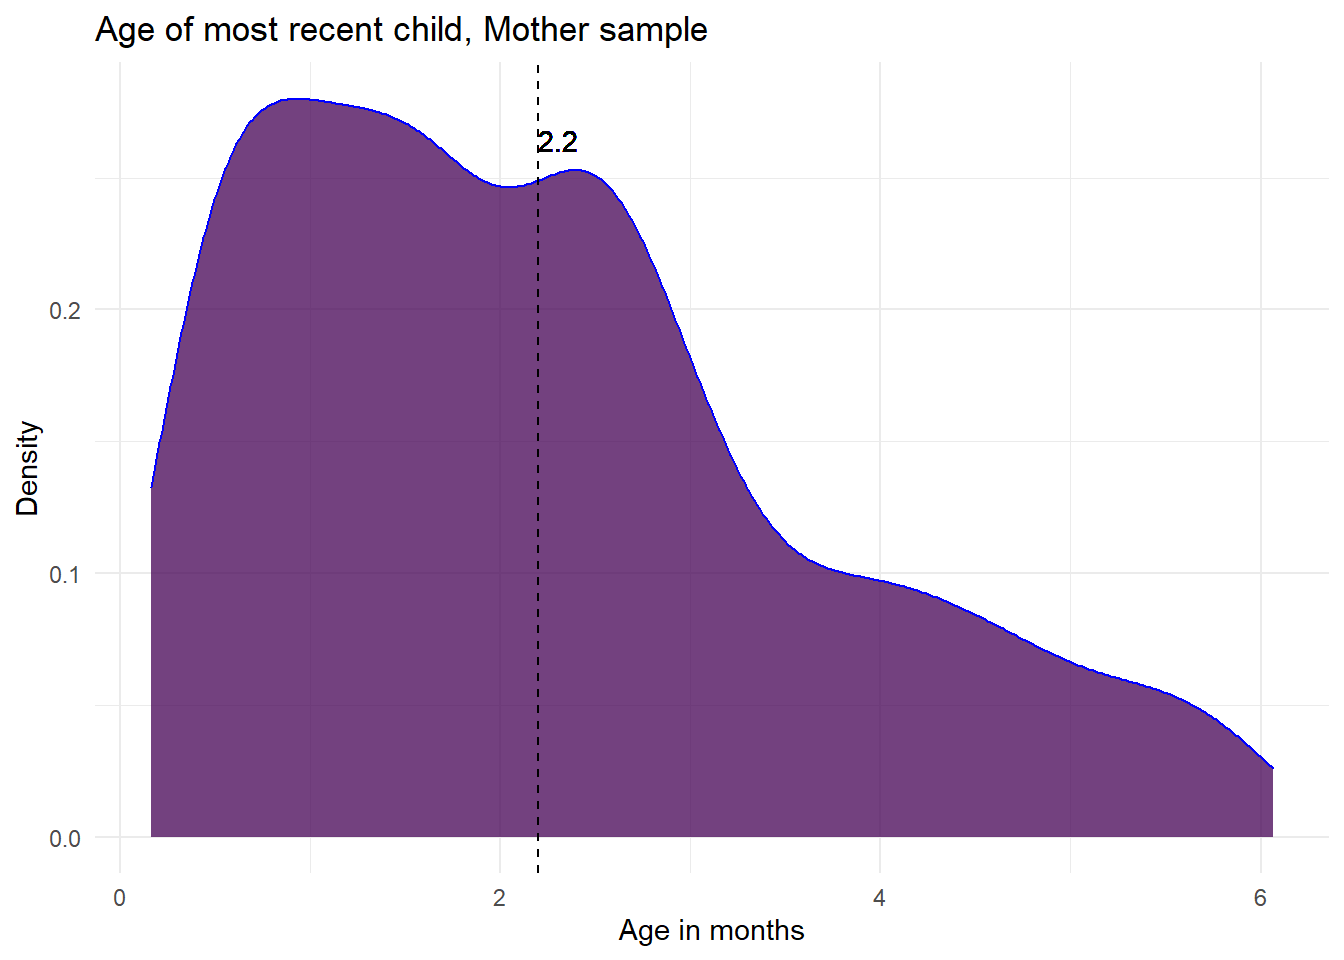
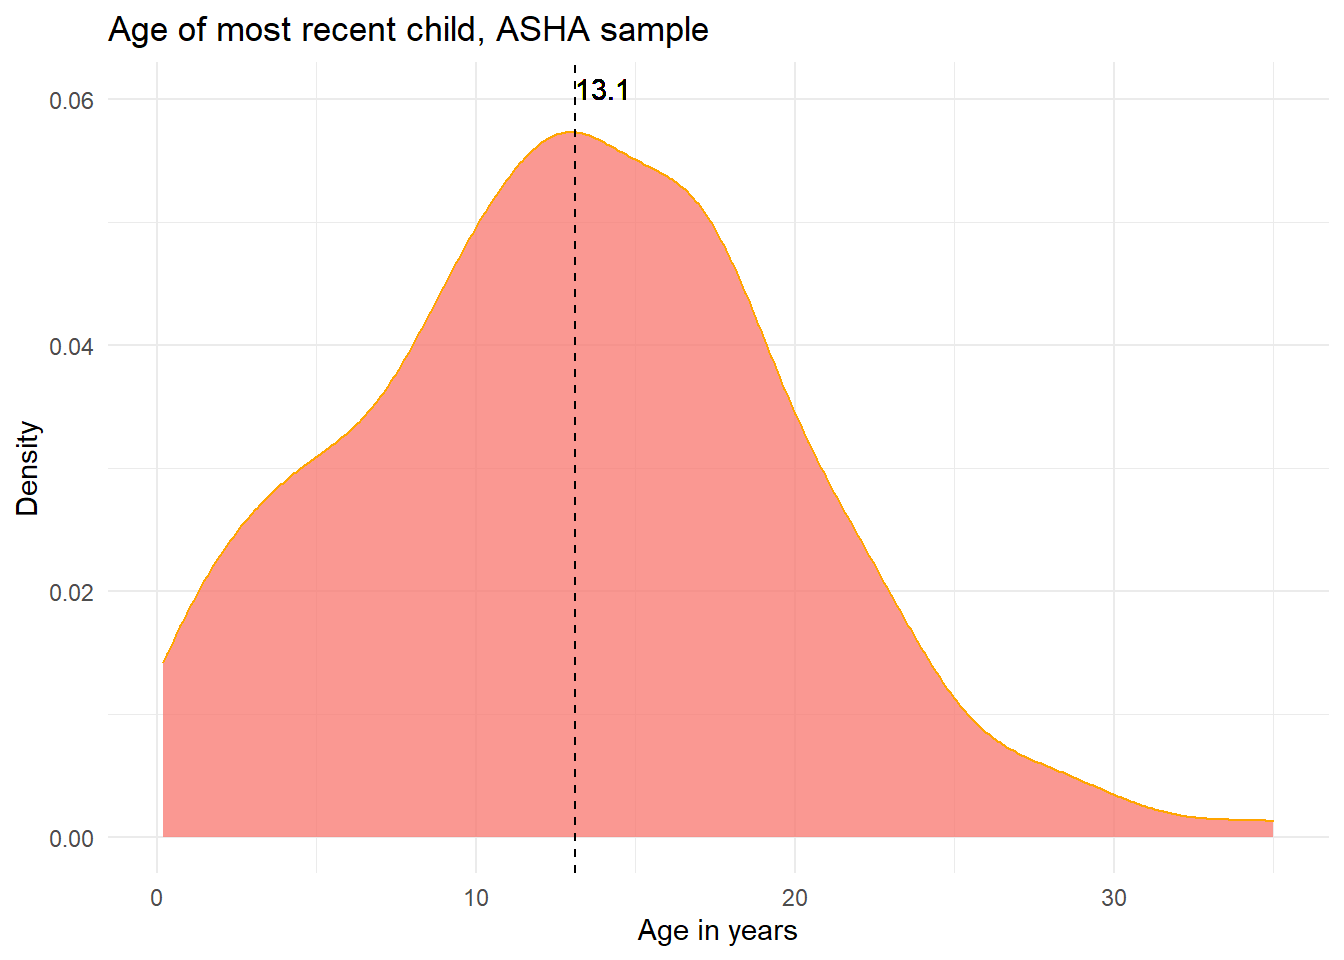
Figure 6.4: Time since most recent birth (age of youngest child)
The average age of the ASHA’s youngest child is 13.1 years but only 2.2 months for mothers. Later on we examine if ASHAs who have been mothers since they became ASHAs are more likely to self-report higher levels of engagement with recommended health behaviors (they do, see Section 7.3).
6.3.0.3 Religion and caste
One Project RISE objective is to describe ways that community heterogeneity might affect service delivery. Religion and caste are two of the most immediately relevant social factors to examine. For mothers and ASHAs, the religious affiliations in this sample are:
| Religion | ASHA | Mother | ASHA_percent | Mother_percent |
|---|---|---|---|---|
| Hindu | 386 | 1022 | 96.5 | 87.2 |
| Muslim | 12 | 142 | 3.0 | 12.1 |
| Other | 2 | 8 | 0.5 | 0.7 |
In ASHAs, about 10% more women are Hindu and about 10% fewer are Muslim compared to the mothers sample.
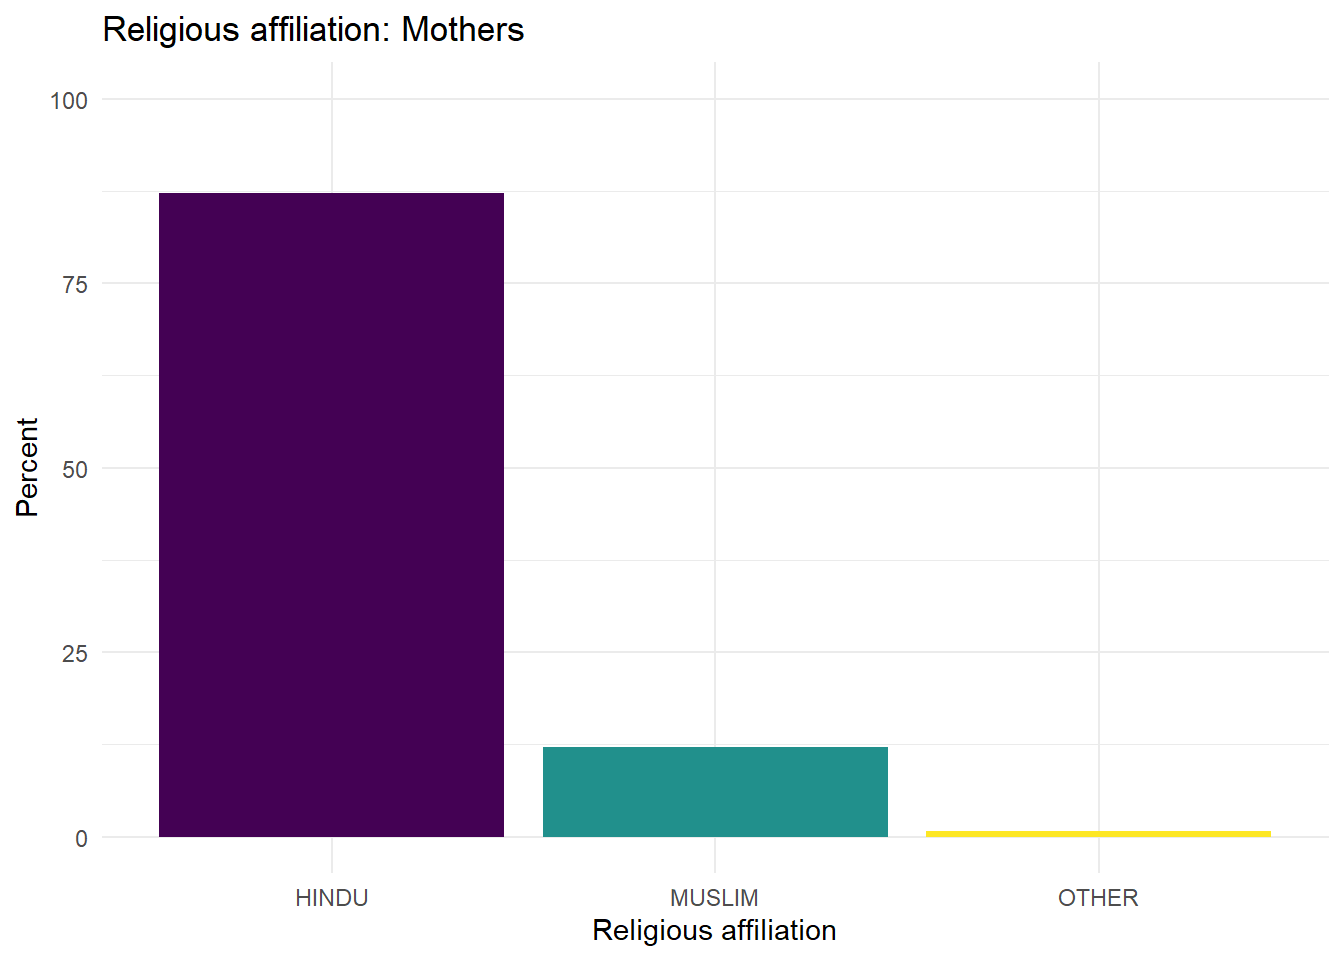
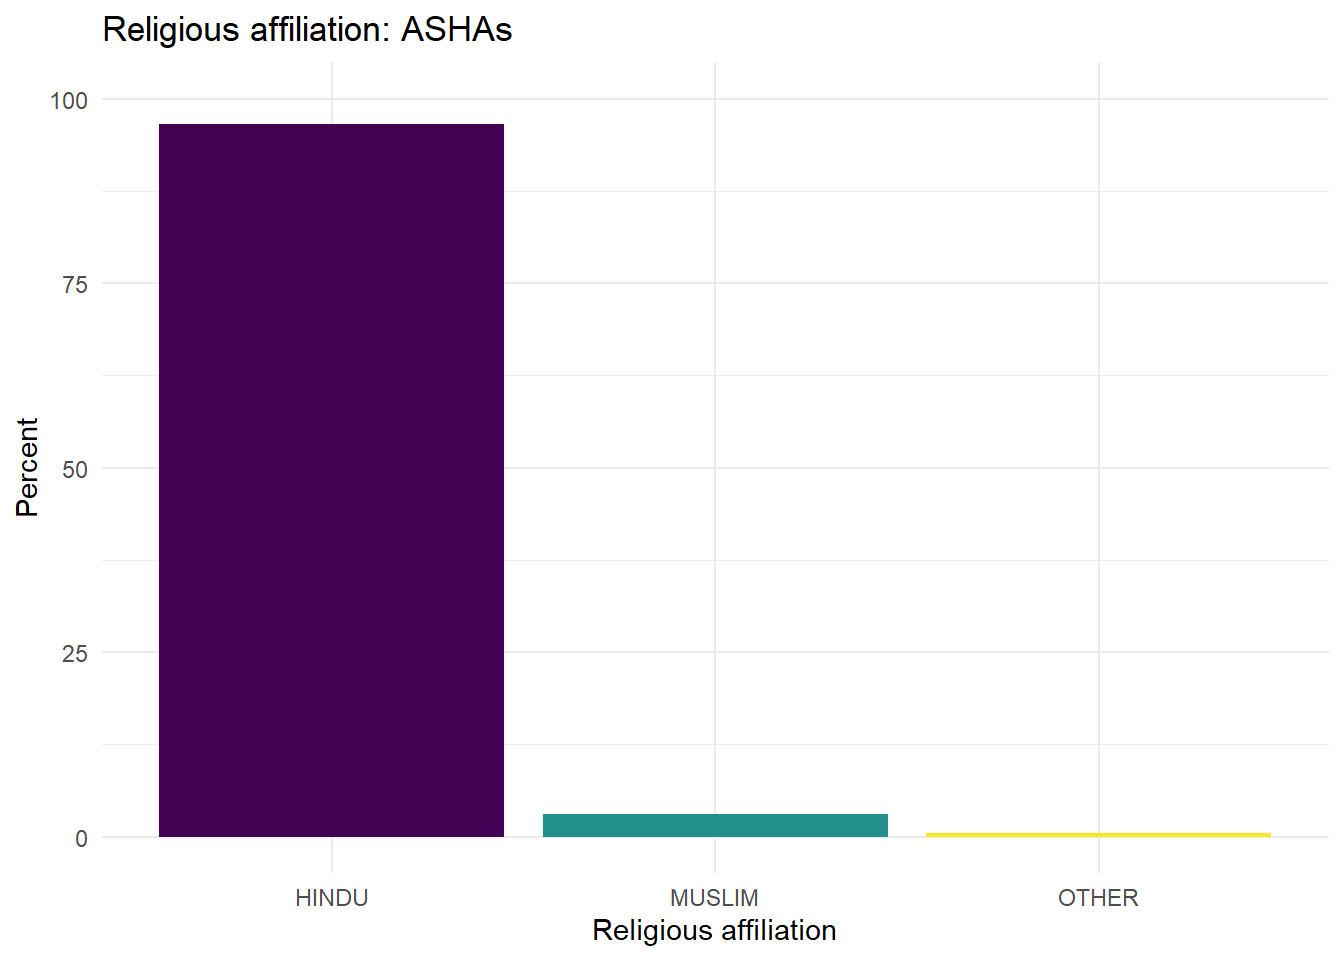
Figure 6.5: Religious affiliations
Caste is recorded in two ways. One we refer to as the ‘Census Caste,’ which is the designation system used by the Government of India and collapses many traditional castes into larger units. The other is the self-reported traditional caste.
For census caste we have:
| Caste | ASHA | Mother | ASHA_percent | Mother_percent |
|---|---|---|---|---|
| General | 68 | 80 | 17.0 | 6.8 |
| Scheduled Caste | 67 | 358 | 16.8 | 30.5 |
| Scheduled Tribe | 3 | 18 | 0.8 | 1.5 |
| Obc | 262 | 716 | 65.5 | 61.1 |
The biggest difference is the percentage of each sample that is ‘Scheduled Caste,’ which is 31% of the mother sample and 17% of the ASHA sample. ASHAs also have higher percentages that are OBC and General caste than mothers.
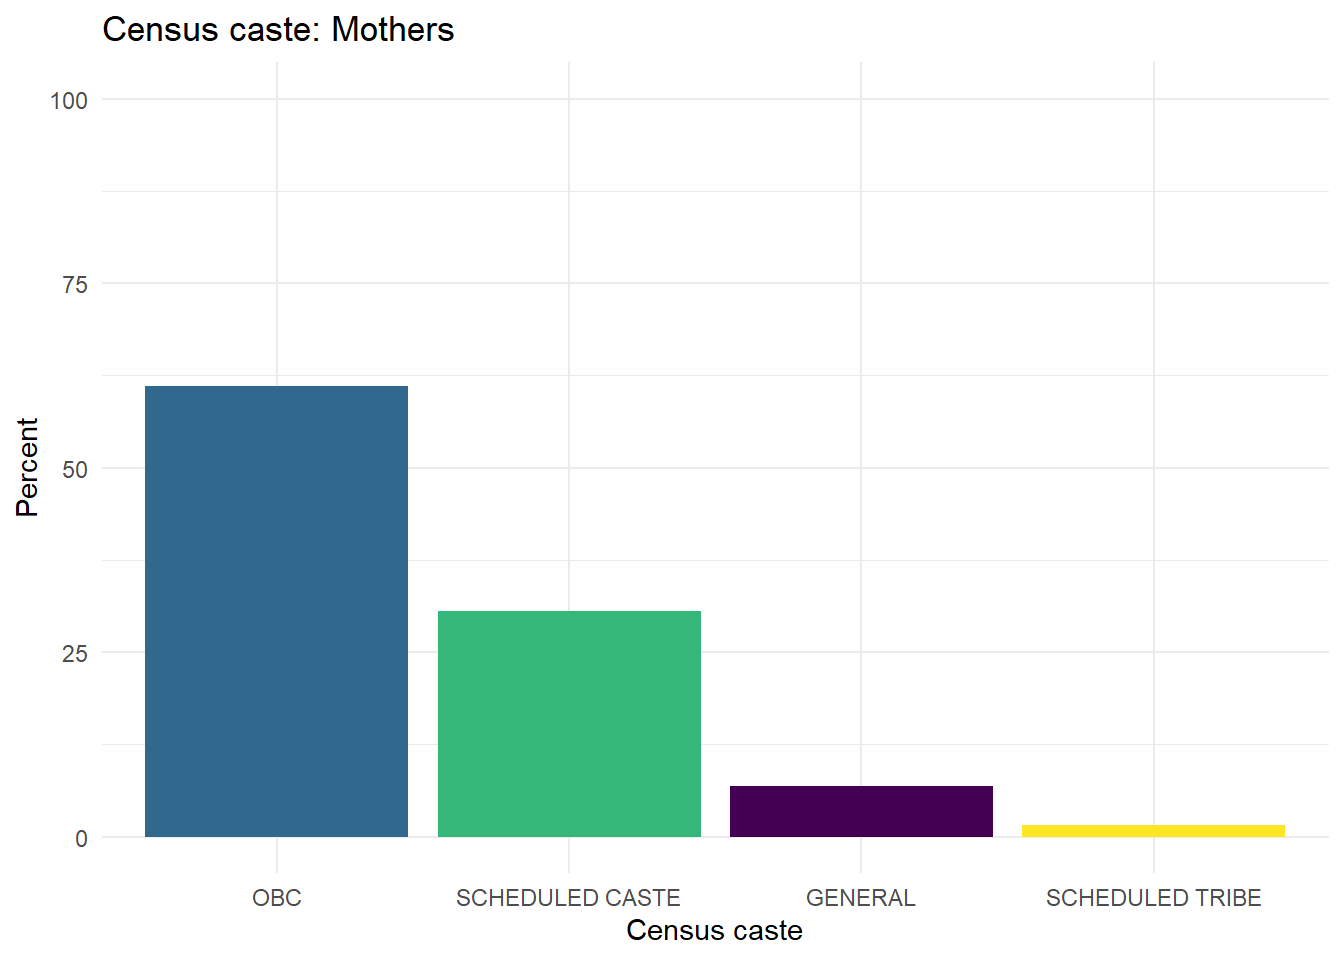
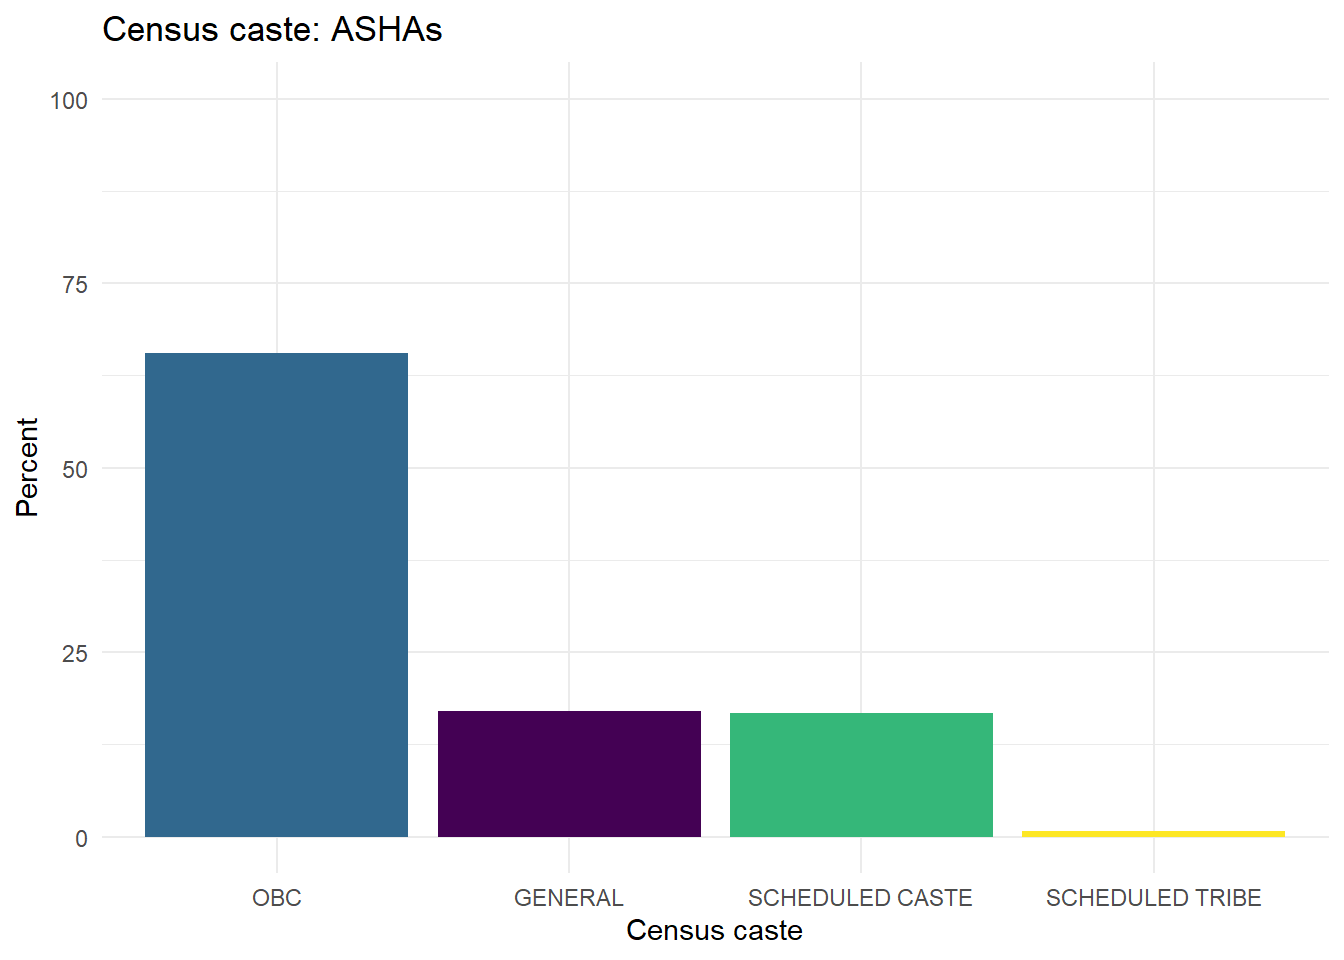
Figure 6.6: Census caste affiliations
In addition to the Census Castes, our survey asked participants to name their individual historical caste. These two caste categorization systems are related in that the ‘Census Castes’ are based on the self-identified castes. The central and state governments of India publish lists that link the local historical castes to this broader census-based system. In Bihar, the Gwala (Yadav) caste is the most prevalent caste, which in turn is part of the OBC census caste. Other common OBC castes are Koiri, Mallah, Ansari (muslim), Kurmi, Teli, Nai, Tantwa, Noniya and Pasi. The most prevalent scheduled castes are Musahar, Dusadh, and Chamar. The most common general castes (upper castes) are Brahman, Bhumihar, and Rajput.
In the ASHA sample there is a disproportionately lower representation of Scheduled Castes (the Schedule Caste population in Bihar is a much larger proportion than it is in this sample of ASHAs). Members of Scheduled Castes have been the most marginalized communities in Bihar.
The government categorization places many castes into the same categories. For example, in the mother data there were 87 unique responses self-identified castes, thirty-two of which were only named one time.
For reference, the 12 most commonly named castes for each sample are in this table:
|
Mothers
|
ASHAs
|
||||
|---|---|---|---|---|---|
| Caste | Count | Proportion | Caste | Count | Proportion |
| Gwala | 183 | 0.16 | Gwala | 70 | 0.17 |
| Musahar | 113 | 0.10 | Koeri | 51 | 0.13 |
| Dusadh | 103 | 0.09 | Brahman | 25 | 0.06 |
| Chamar | 91 | 0.08 | Chamar | 24 | 0.06 |
| Koeri | 76 | 0.06 | Teli | 22 | 0.06 |
| Mallah | 54 | 0.05 | Dusadh | 21 | 0.05 |
| Ansari | 47 | 0.04 | Kurmi | 21 | 0.05 |
| Kurmi | 43 | 0.04 | Bhumihar | 16 | 0.04 |
| Teli | 34 | 0.03 | Rajput | 14 | 0.04 |
| Tantwa | 28 | 0.02 | Baniya | 11 | 0.03 |
| Noniya | 23 | 0.02 | Nai | 11 | 0.03 |
| Pasi | 23 | 0.02 | Mallah | 10 | 0.03 |
6.3.0.4 Education
Education rates are fairly low in rural Bihar. About half of the mothers sampled are illiterate. Of the women who reported being literate, most had from 8 to 10 years of school. In the following histogram for years of education in our maternal sample, note that the 583 illiterate women are assumed to have zero years of education. Note also, that many (282) of the 583 illiterate women are below the age of 24. This is noteworthy because it implies high illiteracy in even the youngest age groups (i.e., it is not primarily a generational/age effect).
NOTE: Many of the women who reported being illiterate in the survey did not have an associated number of years of education. We can reasonably assume that the years of education is zero for these women, but note that it is somewhat plausible that a few of these individuals did attend a very limited amount of school. We do not think this could affect the results below.
On average, ASHAs have higher levels of education than their beneficiaries (Figure6.7). This is due largely to the fact that education is a requirement to be an ASHA. Roughly half of the Mother sample has zero years of education, whereas nearly all of the ASHA sample has some education. A few of the ASHAs have less than the recommended amount of education to be an ASHA.
Education is often a strong predictor of health behavior, which prompts us to wonder about barriers to achieving some levels of education. Most of the women who get 1 year go on to get 7 or more years, so the barrier to entering education at all could be important to identify.
Figure 6.8 shows the relationship between caste and the proportion of each sample at a given level of education. General caste is much more prominent at higher levels of education and Scheduled Caste much more prominent at lower levels (Table 6.5).
Over half of all women of Scheduled Caste and nearly half of Scheduled Tribe have zero years of education, compared to about 1/3rd of OBC and 1/5th of General (Table 6.5). Access to education could be improved across this range of caste-based groupings, but particularly so in Scheduled Tribe and Caste (Scheduled Tribe is very small % of overall sample).
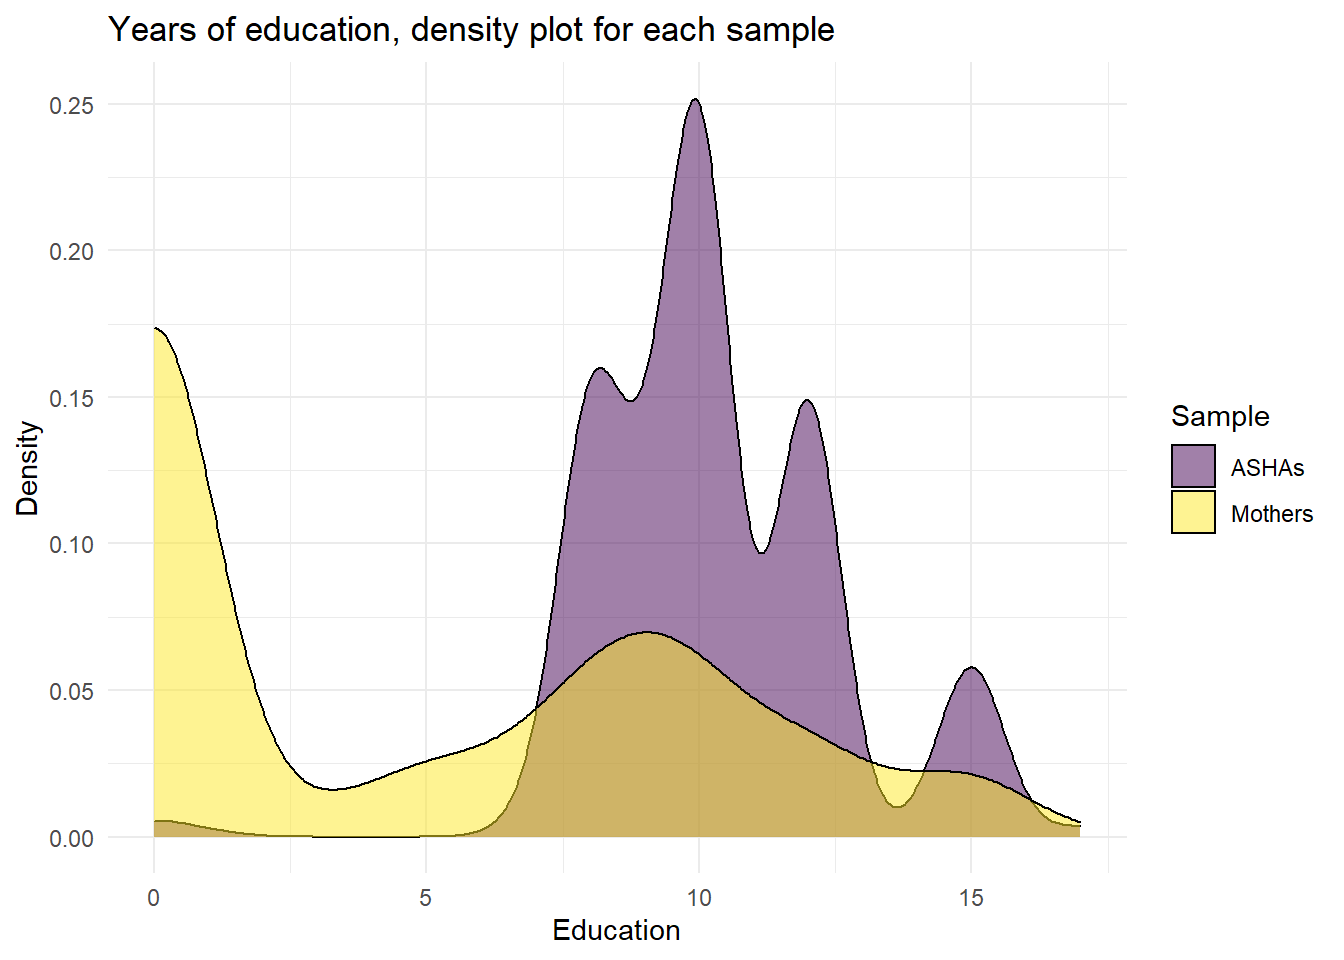
Figure 6.7: Years of self-reported education for each sample
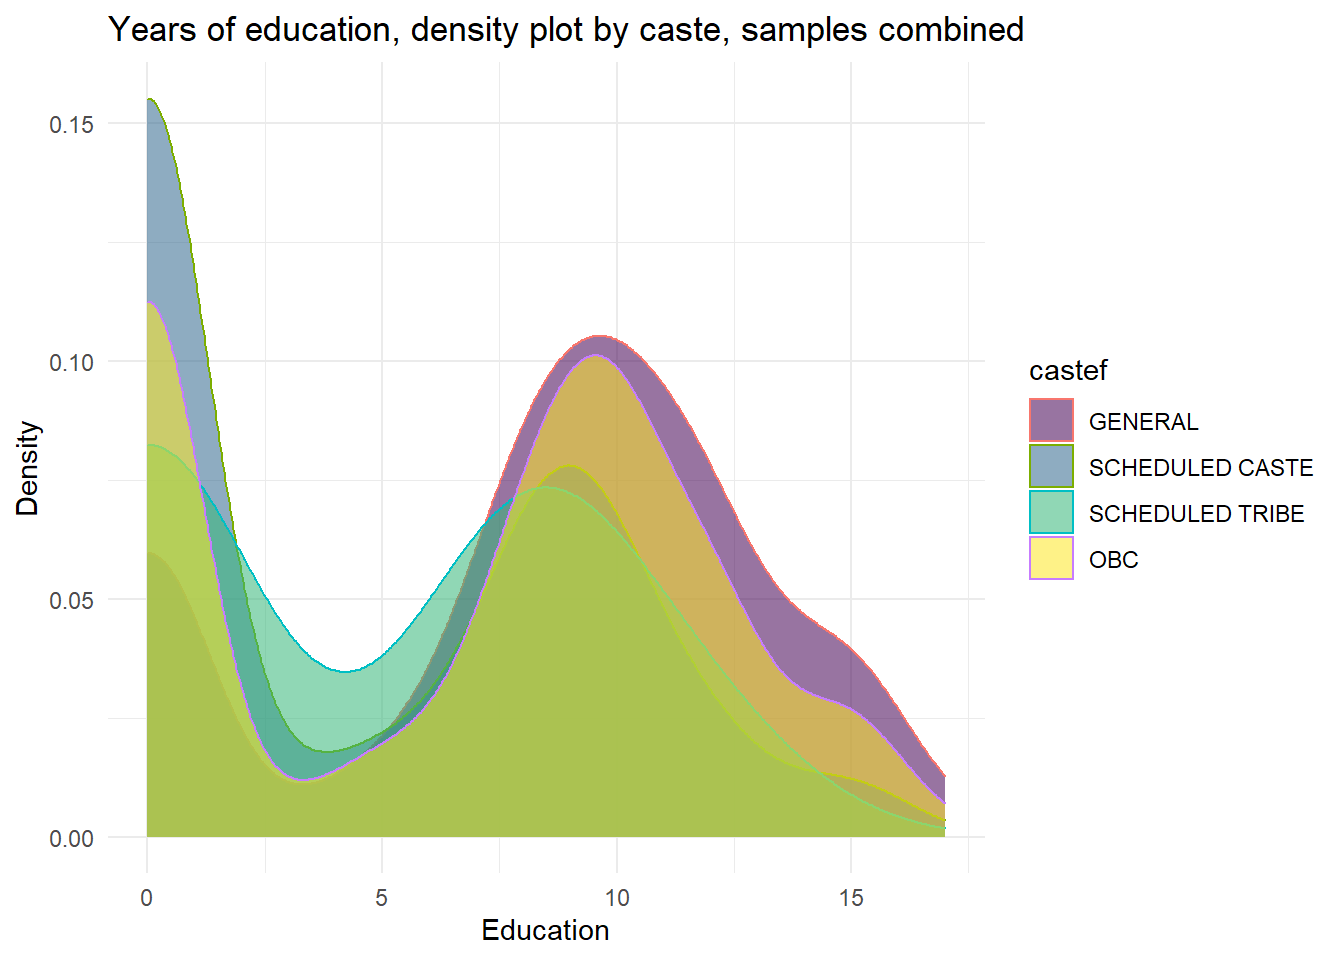
Figure 6.8: Years of self-reported education by caste, both samples combined
| Education | General | Scheduled Caste | Scheduled Tribe | OBC |
|---|---|---|---|---|
| 0 | 20.3 | 50.8 | 47.6 | 33.2 |
| 1to6 | 4.7 | 8.0 | NA | 6.3 |
| 7to8 | 18.9 | 12.2 | 28.6 | 13.3 |
| 9to10 | 25.0 | 19.3 | 14.3 | 25.5 |
| 11to13 | 18.2 | 6.1 | 9.5 | 13.9 |
| 14to17 | 12.8 | 3.5 | NA | 7.8 |
6.3.0.5 The Relationship Between Age and Education
Education and generation are both factors that affect health behavior. In these next two figures we see that ASHAs have (much) higher levels of education on average. However, most of the difference in average education level goes away if we include only literate mothers in the comparison.
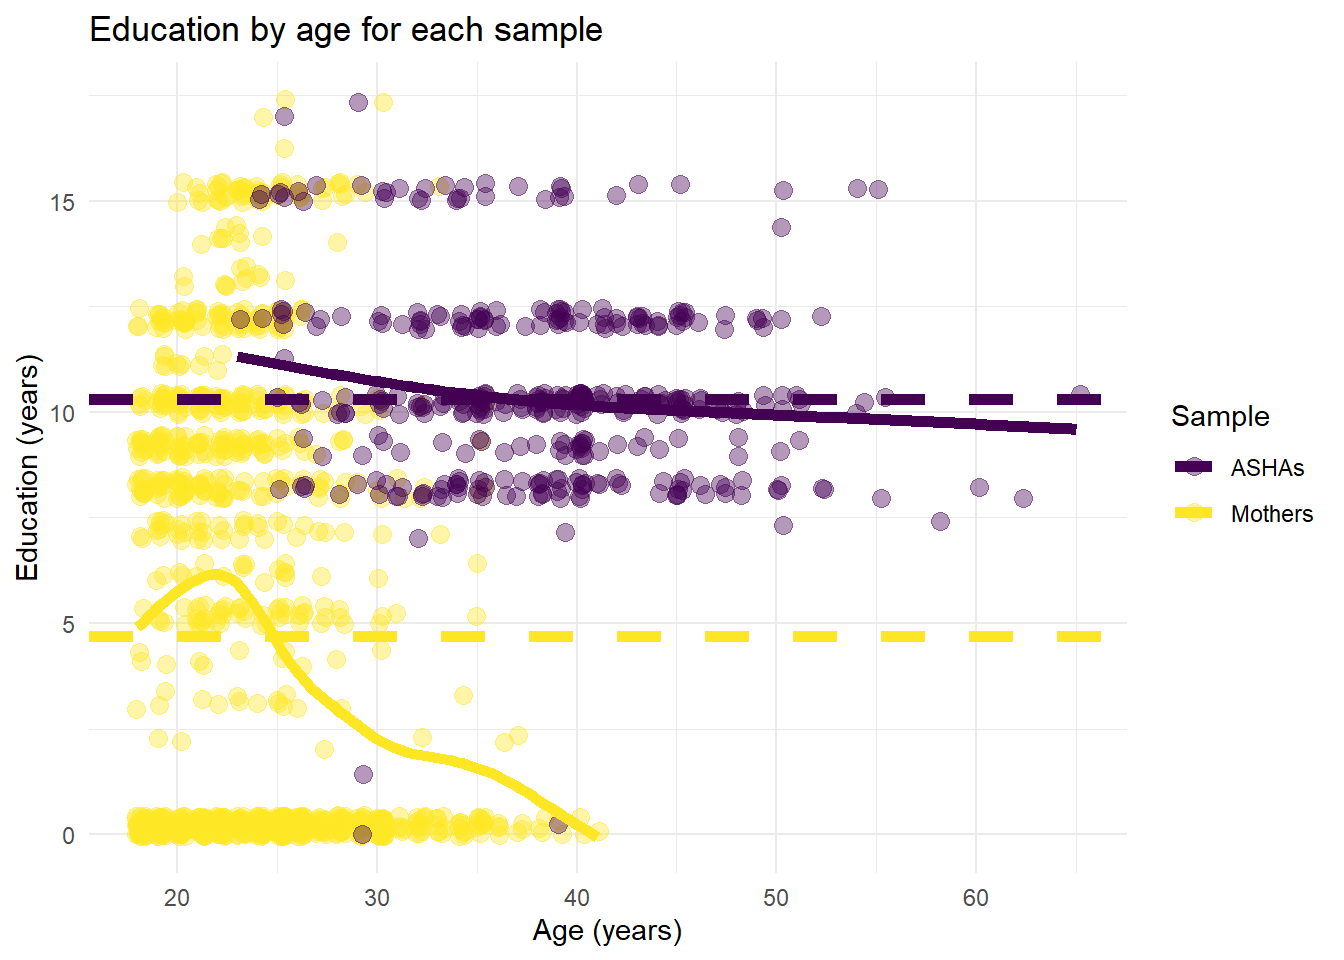
Figure 6.9: Education by age comparing Mother and ASHA samples. The dotted lines are sample mean.
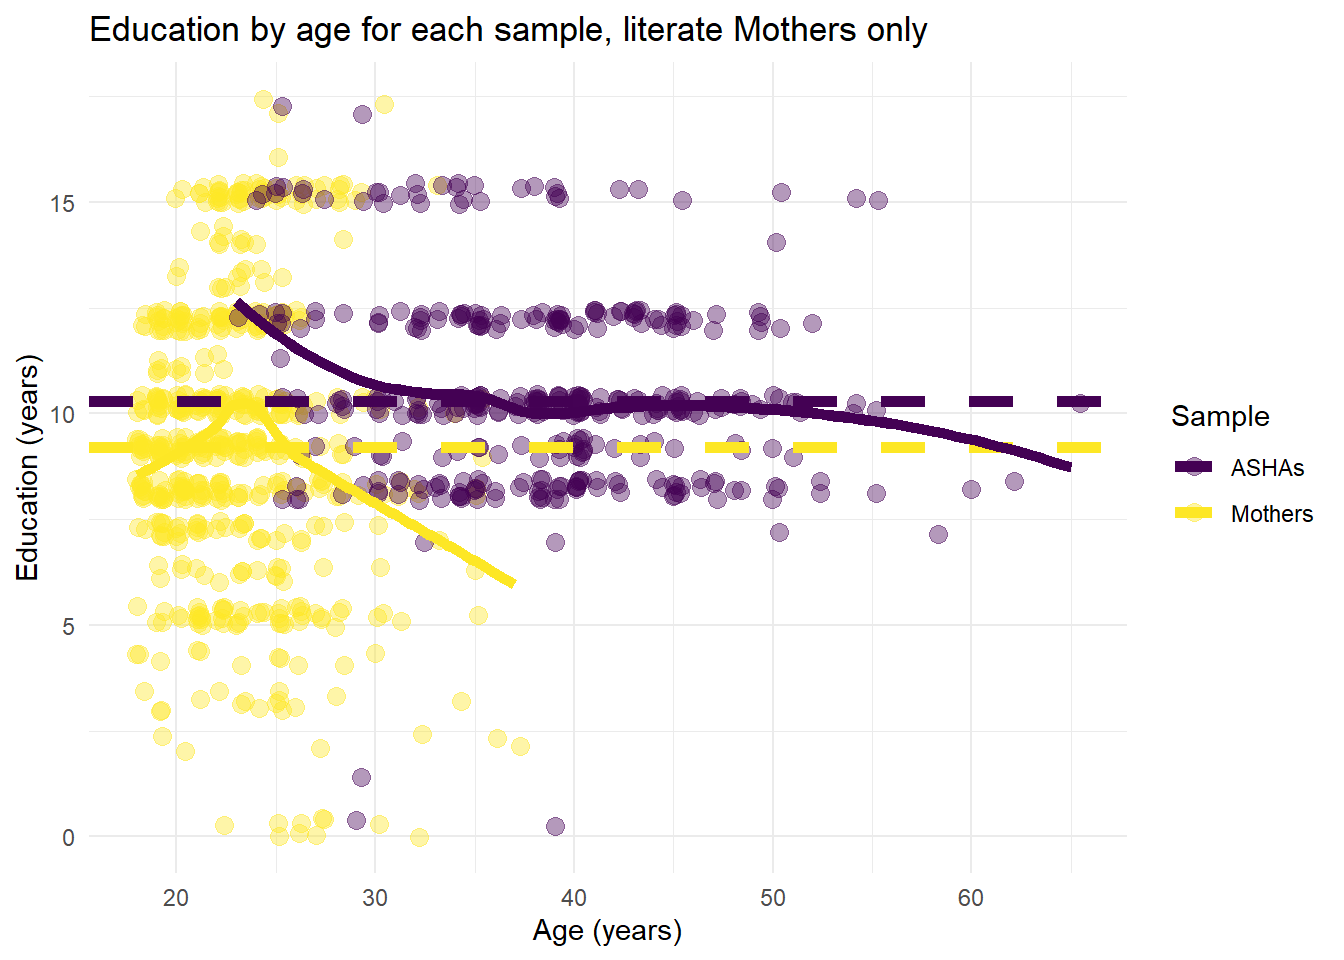
Figure 6.10: Education by age comparing Mother and ASHA samples, literate Mothers only. The dotted lines are sample means.
ASHAs are overall older and more educated than their beneficiaries (Figure 6.9). If we compare ASHAs specifically to literate beneficiaries (the recent mothers who self-reported that they can read and write, which excludes the cases of zero education), the difference in years of education reduces substantially (Figure 6.10). The mean and median levels of education of ASHAs are about a year greater than those of literate beneficiaries (Mother mean and median years of education: 9.18, 9; ASHA mean and median years of education: 10.3 and 10).
6.3.0.6 Wealth
In many behavioral studies in public health or demography, the key outcomes of interest have statistically significant associations with wealth. For Project RISE, household wealth is based on an established approach used in previous studies by PCI and supported by the literature on wealth-measurement.
The measure of wealth is the result of compiling many questions on material possessions and household characteristics and deriving a metric based on the results. As such, presenting information on wealth is a little more complex than the previous measures which are mostly based on a single direct question.
The following tables show the items that comprise the wealth measure and the proportion of participants reporting that they own each item, for each sample (Table 6.6).
| Wealth Measure | Percent_ASHAs | Percent_Mothers | Difference |
|---|---|---|---|
| Assetpressurecooker | 68 | 31 | 37 |
| Assettable | 81 | 48 | 33 |
| Watch | 62 | 35 | 27 |
| Flushtoilet | 46 | 20 | 26 |
| Sewingmachine | 44 | 19 | 25 |
| Blackwhitetelevision | 46 | 24 | 22 |
| Assetchair | 94 | 72 | 22 |
| Motorcyclescooter | 56 | 35 | 21 |
| Assetmattress | 74 | 54 | 20 |
| Pucca | 34 | 16 | 18 |
| Fuallpg | 45 | 27 | 18 |
| Waterpump | 32 | 16 | 16 |
| Bicycle | 79 | 63 | 16 |
| Handpump | 88 | 77 | 11 |
| Assetelectricfan | 97 | 87 | 10 |
| Assetradio | 14 | 7 | 7 |
| Twinpitcompostingtoilet | 14 | 9 | 5 |
| Refrigerator | 10 | 5 | 5 |
| Pitlatrine | 16 | 11 | 5 |
| Tractor | 6 | 3 | 3 |
| Computer | 4 | 1 | 3 |
| Assetcotbed | 100 | 97 | 3 |
| Thresher | 3 | 1 | 2 |
| Telephone | 2 | 0 | 2 |
| Semipucca | 49 | 47 | 2 |
| Car | 3 | 1 | 2 |
| Assetelectricity | 98 | 96 | 2 |
| Internet | 1 | 0 | 1 |
| Animaldrawncart | 1 | 0 | 1 |
| Washingmachine | 2 | 2 | 0 |
| Drytoilet | 0 | 0 | 0 |
| Agriculturalcropwaste | 12 | 15 | -3 |
| Fualwood | 24 | 31 | -7 |
| Dungcakes | 16 | 24 | -8 |
| Kucca | 17 | 37 | -20 |
| Mobilephone | NA | 95 | NA |
| Airconditionercooler | NA | 0 | NA |
Items more frequently associated with ASHAs include: Pressure cookers, a table, a watch, a flush toilet, sewing machine, chair, television, a motorcycle or scooter, and a mattress. The main item more typical of beneficiary households is Kucca (a common rural house type). This refers to a less durable house structure that is made from wood, stones, clay, mud, leaves, thatch, or the residue from crops. These houses are much more prominent among recent mothers compared to ASHAs, indicating the socio-economic difference between the two samples.
To form a wealth index, a statistical technique called principle component analysis was used to transform this list of possessions into a single continuous metric, which is then centered by the overall mean value and normalized by its standard deviation.
The resulting metric shows that ASHAs are significantly more wealthy than their beneficiaries (Figure 6.11). The median wealth for ASHAs is about 0.5 standard deviations above the group mean and for mothers its about 0.25 below it (a difference that is statistically ‘significant’).
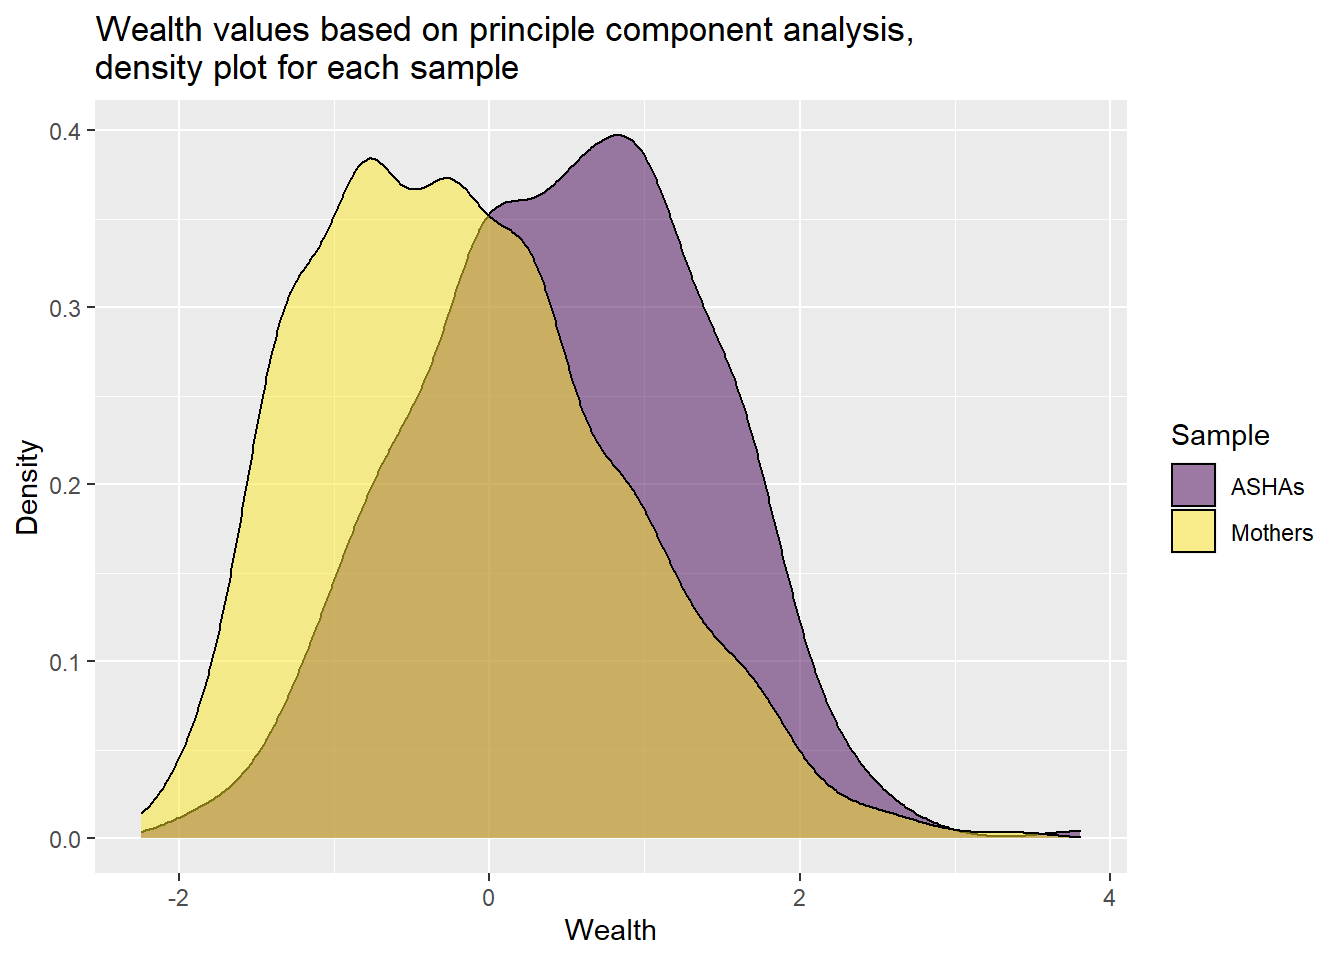
Figure 6.11: Composite wealth measure
Figure 6.12 shows that the tendency for ASHAs to come from wealthier households is likely present within each major census caste.
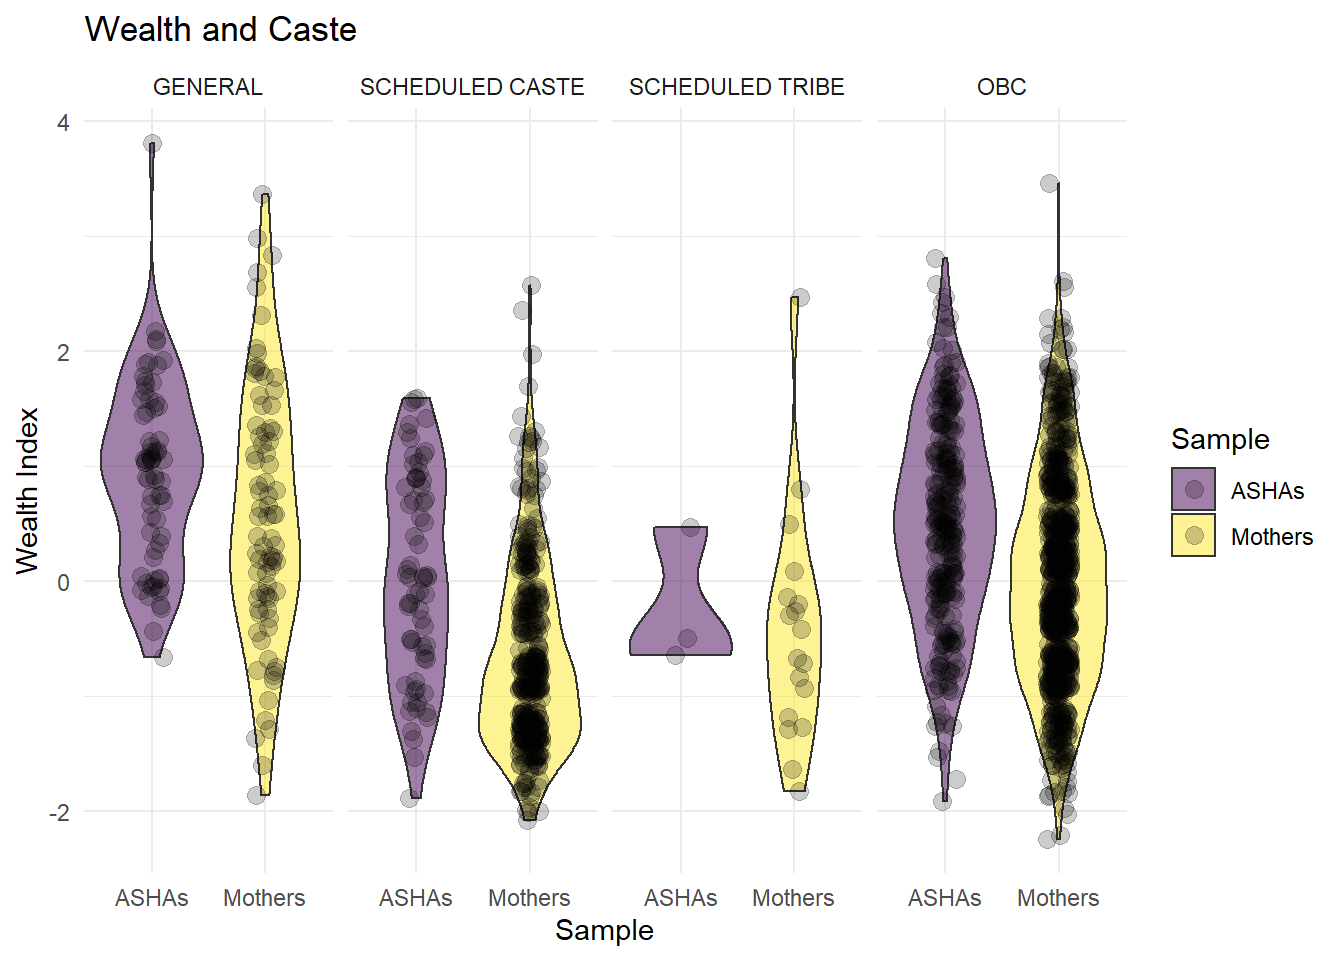
Figure 6.12: Wealth index by sample and caste.
6.3.0.7 The Relationship Between Wealth and Education
The relationship between education and wealth seems to be similar for each sample, but the ASHAs are on average more educated (Figure 6.13).
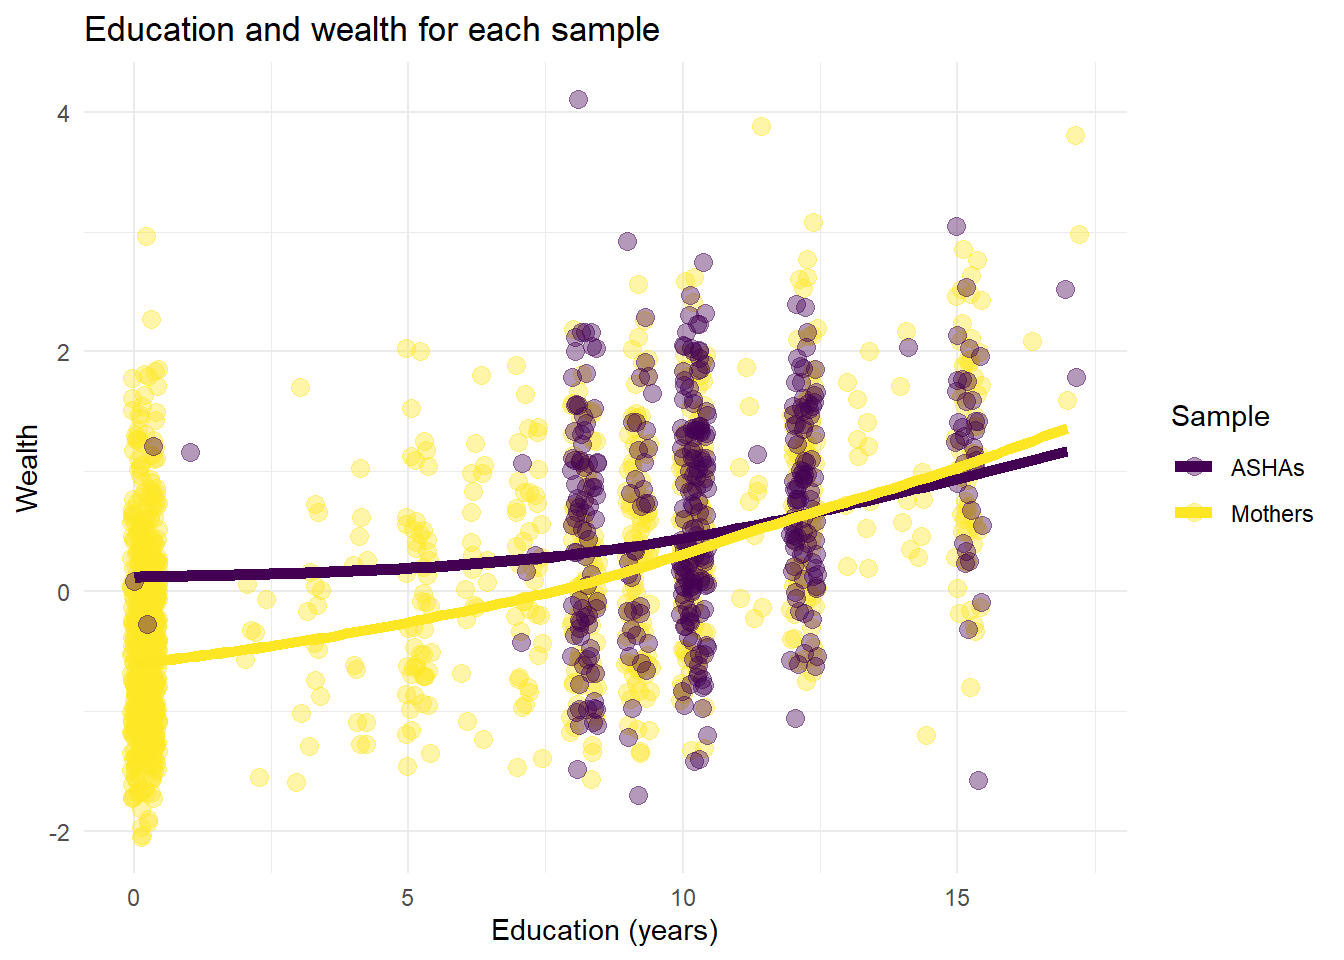
Figure 6.13: Education and Wealth: Comparing Mother and ASHA samples (all data).
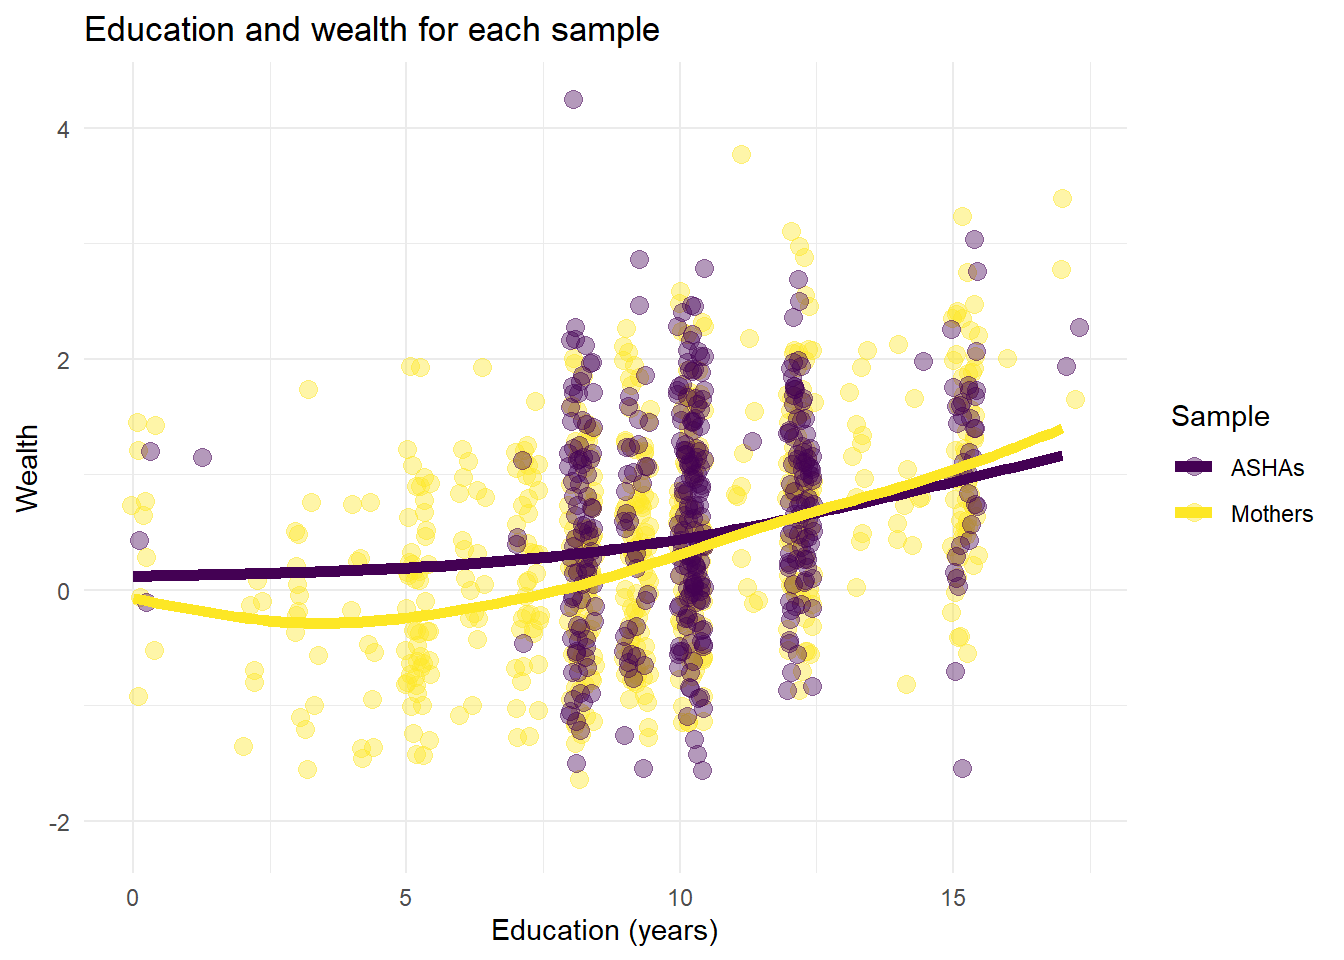
Figure 6.14: Education and Wealth: Comparing Mother and ASHA samples, literate Mothers only.
6.3.0.8 Family Type
Another question asked participants about the type of family in their household, with two options, joint or nuclear. While this doesn’t play a major role in further analysis in this Report, it should be noted that ASHAs have a much higher percentage than Mothers who reside in nuclear family households. Living in a nuclear household could perhaps be associated with more modern or progressive families.
| Sample | JOINT | NUCLEAR |
|---|---|---|
| Mothers | 71 | 29 |
| ASHAs | 55 | 45 |
Take-home message
ASHAs differ in some ways from beneficiaries of the same communities.
The percent of ASHAs who are Hindu is higher than mothers.
Compared to ASHAs, a higher percentage of mothers are Scheduled Caste and a lower percentage are OBC and General.
ASHAs are on average older, more wealthy, and more educated, but the relationship between wealth and education is similar in both samples (the main difference is the fraction of beneficiaries who become literate and educated).
Across these differences it is not yet clear which if any might affect service delivery or perception of ASHA services. The disproportionately low representation of Scheduled Castes among ASHAs has potential implications for service delivery because castes in this categorization may be associated with negative social stigmas and the concept of untouchability.
In some cases, ASHA - Beneficiary comparisons can illustrate ways that the lived-experience or individual characteristics of an ASHA might differ from women in her community. In other cases it is more sensible to see any differences as primarily due to age and time.