6.5 ASHA Workload and Remuneration
In this section we ask some basic questions about the ASHA’s workload and what she reports about incentivized tasks and task preferences. The goal is to formulate a general quantified picture for the range of tasks that ASHAs manage, the time requirements to do them, and how ASHAs feel about or perceive them.
6.5.1 Challenges of Workload
First we present an overview that compares the hours reported by mothers for the time it takes to manage a household compared to the time ASHAs report for managing their professional duties (Figure 6.17). This gives a rough estimate for how much additional work is required to be an ASHA.
When asked about the time spent per day on ASHA duties, 53% said 3-4 hours, 27% said up to two hours, and 16% said 5-6 hours.
The question asked to mothers was regarding how many hours per day they spend on domestic (unpaid) chores. The survey also asks about paid work, but only 120 of 1172 respondents reported any paid work at all. Within these women, there was no relationship between hours of paid and unpaid work per day (that is, those who did more hours of paid work, weren’t more likely to report less time on household duties or vice versa).
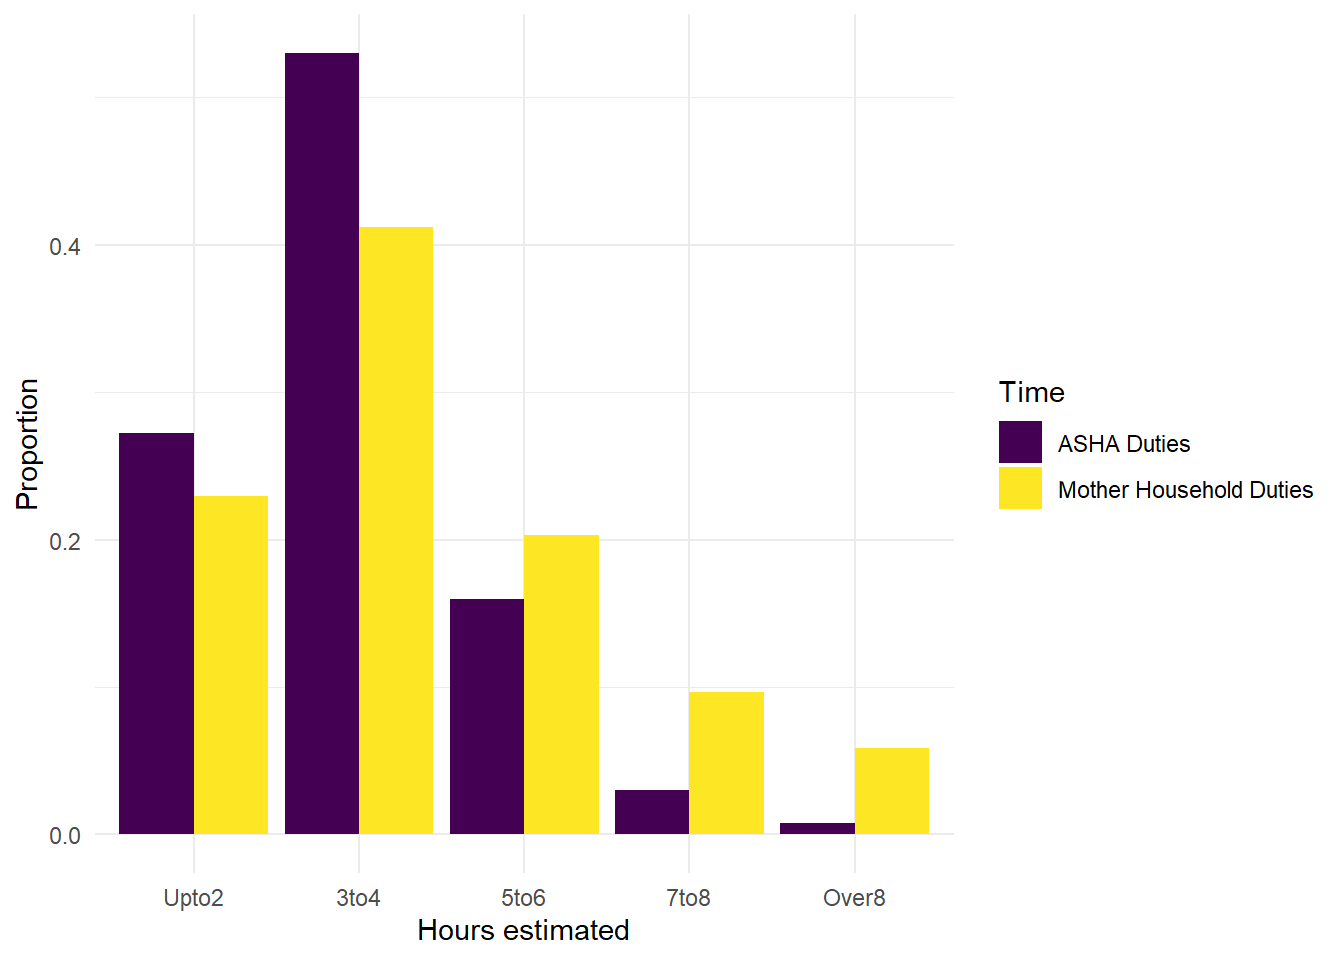
Figure 6.17: Time reported for hours per day on domestic chores by mothers and hours per day for duties by ASHAs.
We also examine components of the ASHA workload.
For instance, the number of pregnant women that ASHAs report as currently pregnant in their catchment areas (Figure 6.18). The most common responses for ASHA were between five and ten, but the range was quite wide, going from 2 to 41 pregnant women per ASHA. Some of the larger service loads (the highest reports of pregnant women per ASHA) could be due to some ASHAs having to serve more than one catchment area at a time.
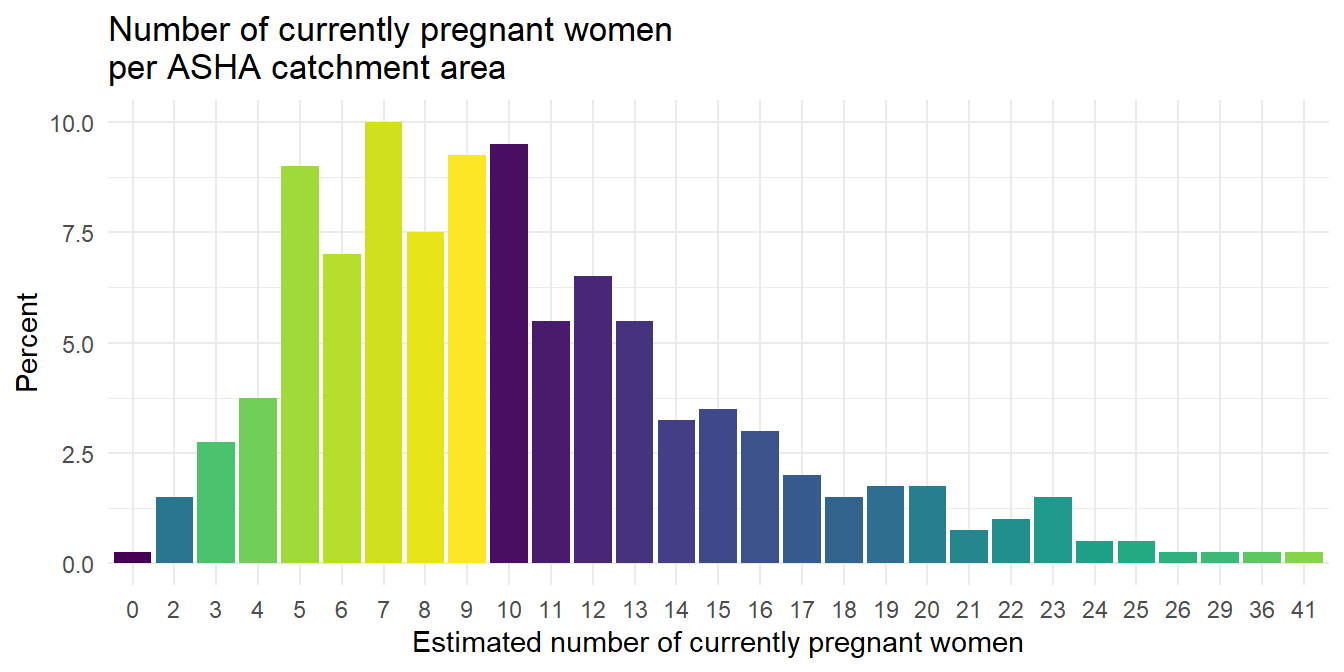
Figure 6.18: Response to survey question: what is the total number of pregnant women currently in your catchment area?, yielding a self-reported estimate for number of beneficiaries that an ASHA manages at one time.
ANC visits
ASHAs also accompany mothers for ANC visits.
According to ASHA self-reports, 71.32% of the most recent ANC visit took less than two hours (majority one hour or less).
Most ASHAs have one or two hours per month on ANC visits, but about ten percent has 5 or more hours per month.
VHND
ASHAs are also engaging in many other tasks at any given time, such as organizing village health and nutrition days (VHND), which occurred in 94.25% of ASHA catchments. ASHAs spent from 1 to 18 hours in preparation for VHSD but 74.01% estimated 5 to 7 hours.
94% of ASHAs reported organizing a VHND in their catchments within the previous month. These commonly required up to up to six hours of preparation time, but 11% said they spent over 8 hours.
Institutional delivery
Institutional deliveries are a high priority and incentivized ASHA duty. One survey question asks how many mothers the ASHA accompanied for institutional delivery within the previous month. To which, 32% said none, 56% said one to three, and very few had more than that.
We also asked about the amount of time spent at the hospital for each ASHA’s most recent institutional delivery. Responses varied from 1 to 48 hours, but 28% responded with 6 or less, 50% with 11 or less, and 75% with 20 or less. Quite a few ASHAs are spending over 12 hours at the hospital for a delivery.
PNC
Post-natal care is an important service area and a potential opportunity space to increase the nature or quality of ASHA-beneficiary interactions.
When asked for the number of households visited in the last 30 days,
- 79% of ASHAs visited 4 or fewer households
- the most common answer was two households, 21%
However, ASHAs are typically visiting households multiple times for PNC care. When asked about the total number of visits,
- 79% did 12 or less
- the most common responses were no visits (10%) and six visits (also 10%)
When asked about the timing of the first PNC visit after the birth, the majority said within the first week:
| Response | Freq | percent |
|---|---|---|
| Within first two days | 113 | 28.25 |
| Within first week | 228 | 57.00 |
| Within first month | 41 | 10.25 |
| Sometime in the first year | 11 | 2.75 |
| Never | 7 | 1.75 |
| Others | 0 | 0.00 |
| Don’t know | 0 | 0.00 |
This overview of ASHA duties does not cover all tasks that she may be asked to complete, but it gives an indication of the principle contributors to her workload.
From month to month, the ASHA workload may vary due to the number of beneficiary services she needs to provide. For instance, the number of pregnant women in an ASHA catchment ranges from 0 to 40 in this sample (!!).
Based on these descriptive findings there are a few things we might want to know more about. For instance, to what degree is monthly or seasonal variation in workload a source of stress for the ASHA? The qualitative data didn’t seem to capture any mentions of this but it would likely be the case that just by chance that in some months there are suddenly many pregnant women requiring services and in others hardly any. How does the ASHA manage such fluctuations? Does the number of active beneficiaries (women requiring services) at any given time contribute to variability in workload to a degree that causes stress or becomes an issue to manage?
Certainly other factors related to the number of deliveries an ASHA has to manage must affect her workload, such as spending nights in the hospital and related challenges or issues related to transportation, which we know is a source of stress.
We also asked the ASHAs about the duties they provided within the previous 30 days (Figure 6.19). This gives a sense for the most common recent duties performed by ASHAs in this sample. We see that family planning and registration of pregnant women are the most common tasks performed, both of which are incentivized.
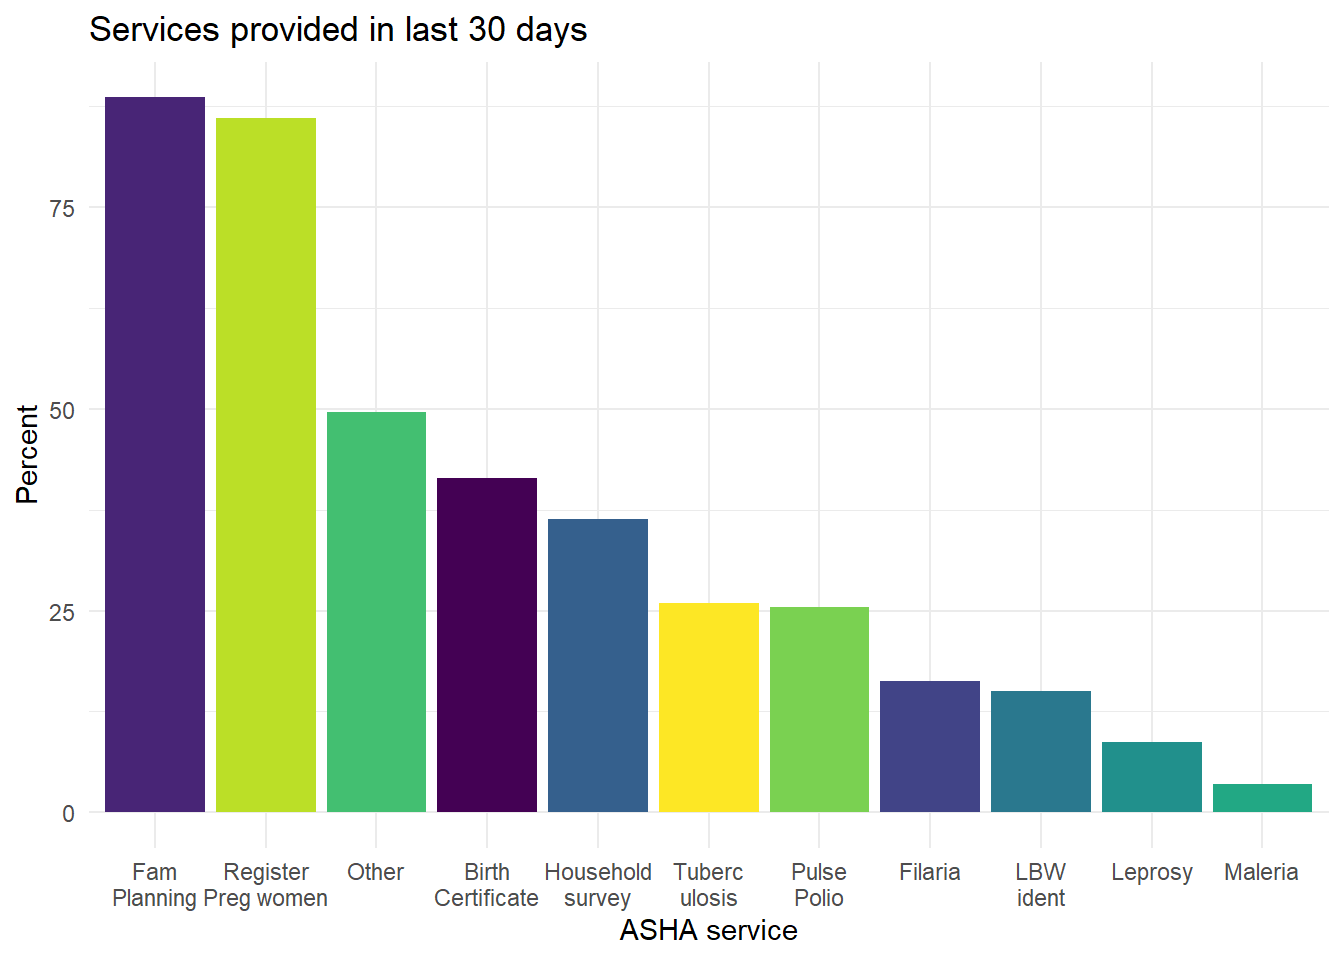
Figure 6.19: Self-report of ASHA services provided within previous 30 days.
Taking a deeper look at the data in Figure 6.19, Table 6.10 shows the number of ASHAs reporting that they performed each service as well as the number of beneficiaries each says received the service. For example, the 338 ASHAs who registered a pregnant woman in the last month registered an average of 3.2 beneficiaries each. For the 143 ASHAs who completed a household survey, the average number of households surveyed was 221.
| Service | Count of ASHAs providing service | Mean number of beneficiaries receiving service | st_dev |
|---|---|---|---|
| Fam Planning | 348 | 7.2 | 9.5 |
| Register Preg women | 338 | 3.2 | 1.8 |
| Other | 195 | 118.9 | 97.3 |
| Birth Certificate | 163 | 5.4 | 35.1 |
| Household survey | 143 | 220.9 | 267.7 |
| Tuberc ulosis | 102 | 1.3 | 0.6 |
| Pulse Polio | 100 | 368.8 | 162.4 |
| Filaria | 64 | 144.9 | 184.8 |
| LBW ident | 59 | 1.4 | 0.9 |
| Leprosy | 34 | 1.4 | 0.9 |
| Maleria | 14 | 2.6 | 2.9 |
6.5.2 Incentives and ASHA Motivation
Incentives are a challenge for ASHAs because they are frequently discussed or named as a job-related concern. In Figure 6.20 we see how the reported incentive amounts vary by service and in Figure 6.21 how the wait times vary by service.
ASHAs frequently discuss incentives with coworkers. For instance, 218 of 391 said they discuss incentives with other ASHAs and 48 of 400 said they discuss incentives with ANMs.
When asked if the incentives are commensurate with the work that ASHAs do, the majority responded that they are paid for less than the work done or that incentives were not at all commensurate (341 of 400).
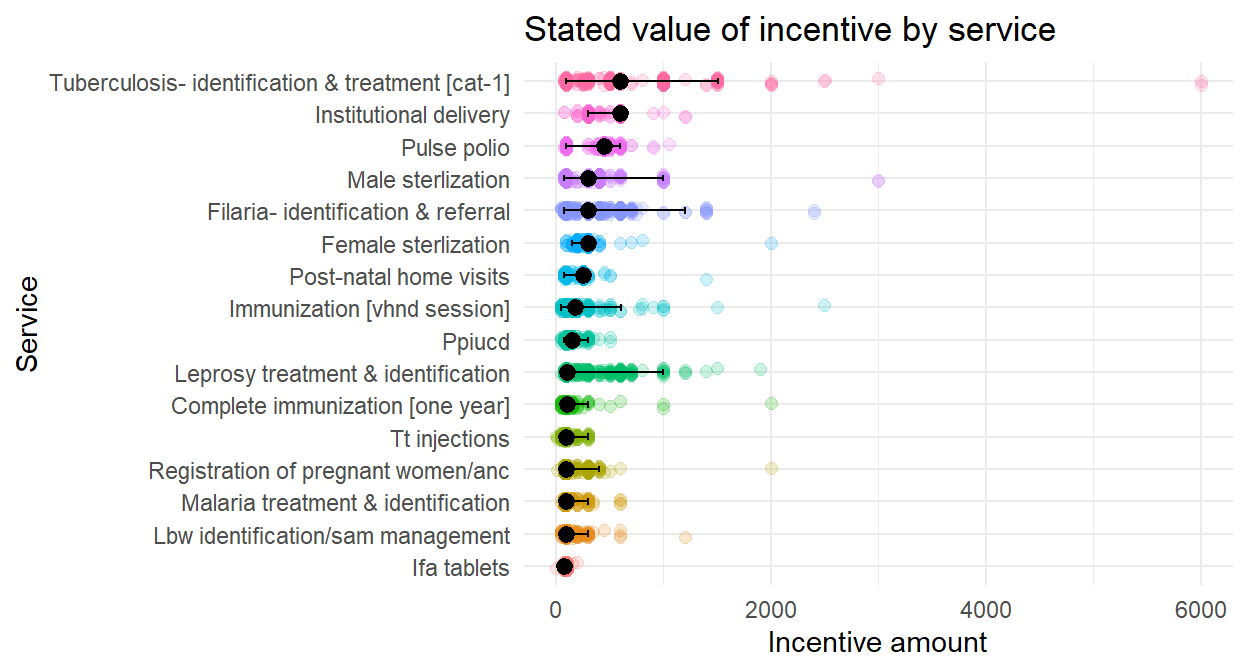
Figure 6.20: Which ASHA services have an incentive and what is its value?
In Figure 6.20 the colored circles are self-reported estimates of incentive amount for each service and the overlaid black dots errors bars are for the median estimate and 95% intervals for each. Tuberculosis and institutional delivery have the highest estimated amounts, while IFA tablets and low birth weight (lbw) identification and treatment have the lowest. The striking aspect of the figure is the variability in reports for each service.
This variability in reported incentive amount is further explored in 6.11.
| Service | Median | Mean | Min | Max |
|---|---|---|---|---|
| Institutional delivery | 600 | 568.0 | 77 | 1200 |
| Tuberculosis- identification & treatment [cat-1] | 600 | 695.9 | 77 | 6000 |
| Pulse polio | 450 | 432.4 | 77 | 1050 |
| Female sterlization | 300 | 287.2 | 99 | 2000 |
| Filaria- identification & referral | 300 | 347.7 | 50 | 2400 |
| Male sterlization | 300 | 301.4 | 77 | 3000 |
| Post-natal home visits | 250 | 226.6 | 77 | 1400 |
| Immunization [vhnd session] | 175 | 194.0 | 50 | 2500 |
| Ppiucd | 150 | 138.6 | 50 | 500 |
| Complete immunization [one year] | 100 | 117.3 | 50 | 2000 |
| Leprosy treatment & identification | 100 | 275.4 | 50 | 1900 |
| Lbw identification/sam management | 99 | 117.1 | 50 | 1200 |
| Malaria treatment & identification | 99 | 110.8 | 50 | 600 |
| Registration of pregnant women/anc | 99 | 137.1 | 10 | 2000 |
| Tt injections | 99 | 99.6 | 0 | 300 |
| Ifa tablets | 77 | 86.0 | 0 | 200 |
Why are ASHA reports of incentive amounts so variable? One possibility is that the mechanisms for submitting and tracking reimbursements is cumbersome. The system does not tag each reimbursement with any particular service and delays are very common resulting in multiple incentives accumulating and getting collapsed into single bulk payments that lack clear itemized descriptions, making it difficult for the ASHA to know for sure how much she is actually receiving for each individual service, let alone accurately categorize them by each service provided. Second, the training the ASHAs receive around incentives is poor and incomplete. Another possibility is that the in many cases the financial part of the ASHA’s job is managed by their husbands, resulting in reduced visibility of exactly what is coming in and for which services.
We also asked ASHAs about the amount of time that they waited to receive incentives. These also appear highly variable, based on visual inspection of Figure 6.21, but the median wait times for each service are all less than 16 days.
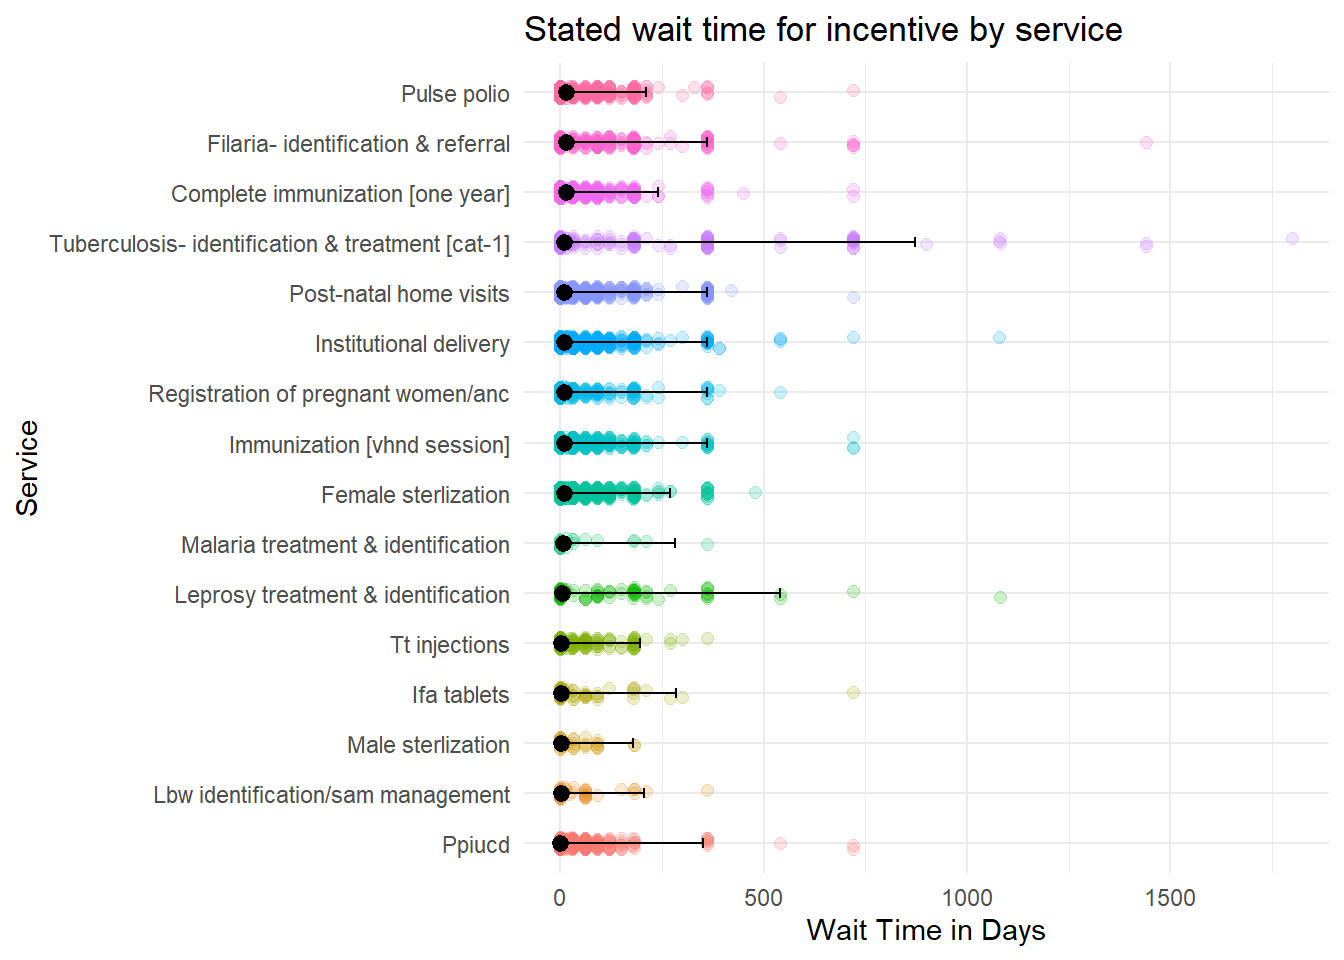
Figure 6.21: How long did ASHAs wait for incentives?
| Service | Median_wait_days |
|---|---|
| Complete immunization [one year] | 15.0 |
| Filaria- identification & referral | 15.0 |
| Pulse polio | 15.0 |
| Institutional delivery | 10.0 |
| Post-natal home visits | 10.0 |
| Tuberculosis- identification & treatment [cat-1] | 10.0 |
| Immunization [vhnd session] | 9.0 |
| Registration of pregnant women/anc | 9.0 |
| Female sterlization | 8.0 |
| Malaria treatment & identification | 7.5 |
| Leprosy treatment & identification | 4.0 |
| Ifa tablets | 2.0 |
| Tt injections | 2.0 |
| Lbw identification/sam management | 1.0 |
| Male sterlization | 1.0 |
| Ppiucd | 0.5 |
6.5.2.1 Incentive preferences
In light of the mean and variance in weight times and amounts, above, we also investigate which ASHA duties are preferred the most (and the least).
The most preferred services are organizing immunization sessions and institutional deliveries (Figure 6.22).
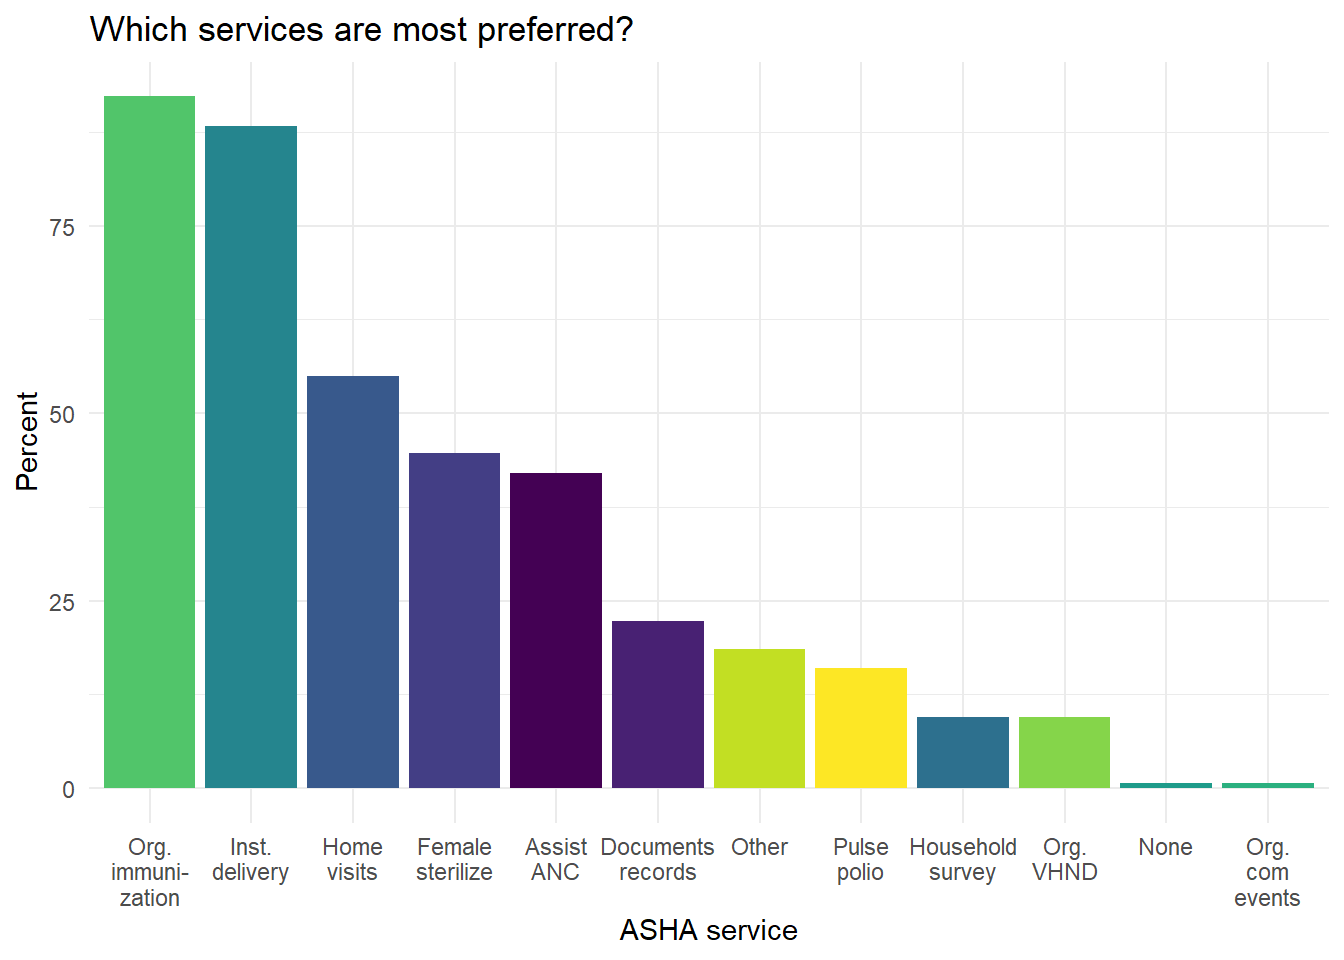
Figure 6.22: Which services do ASHAs say they prefer the most?
As a followup, we also asked the ASHAs why they preferred their most-preferred services. The two most common reasons for preferring services were how interesting they were to perform and the incentive amount (Figure 6.23).
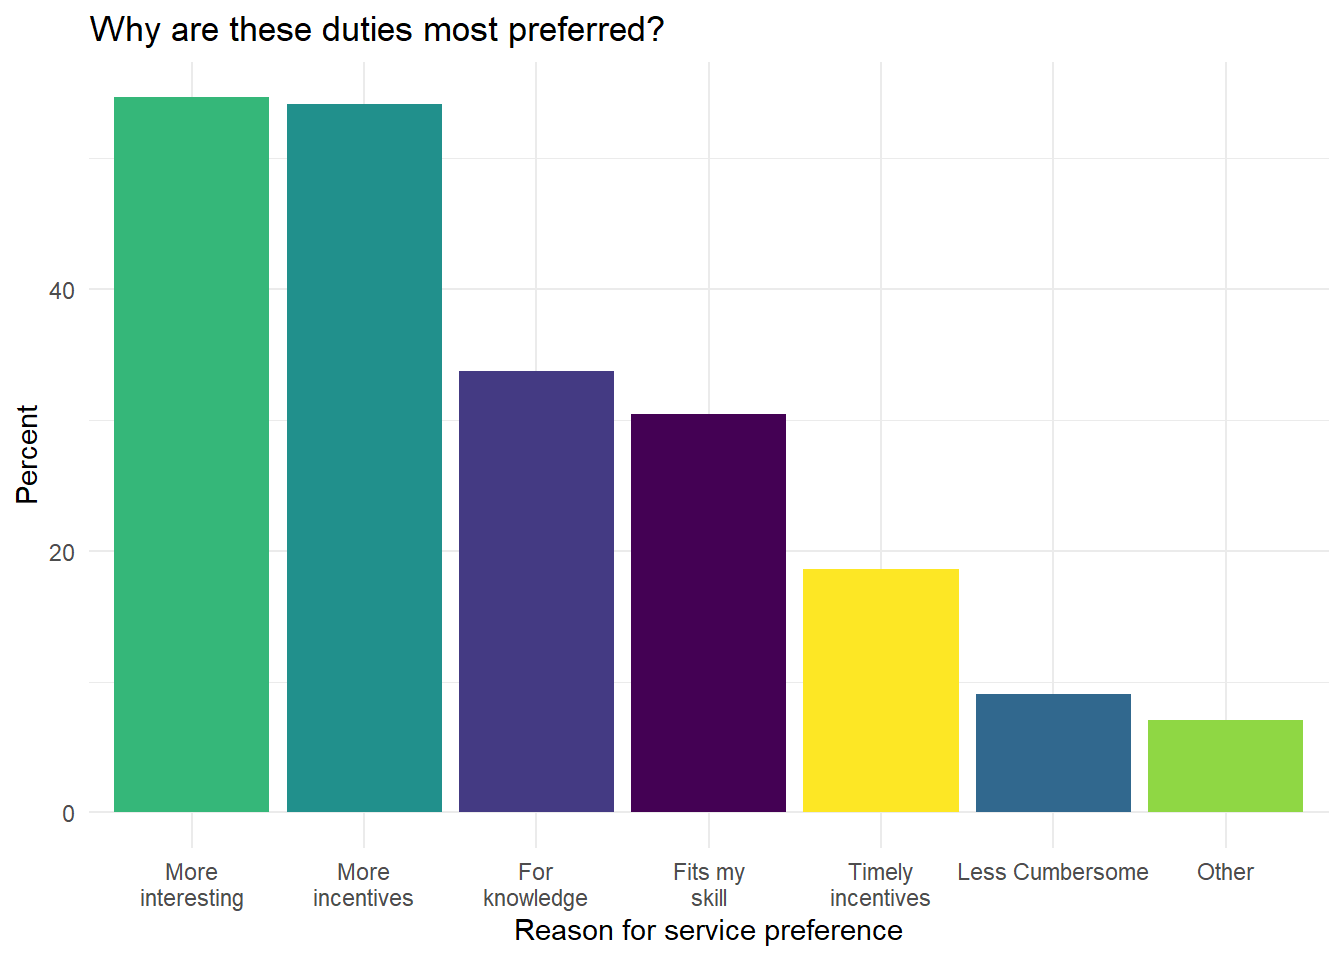
Figure 6.23: What are the reasons why ASHA prefer the most-preferred services?
The most common responses ASHAs gave for which services they prefer the least are Pulse Polio and ‘None,’ meaning that there are none that they don’t prefer doing, followed by household surveys (Figure 6.24).
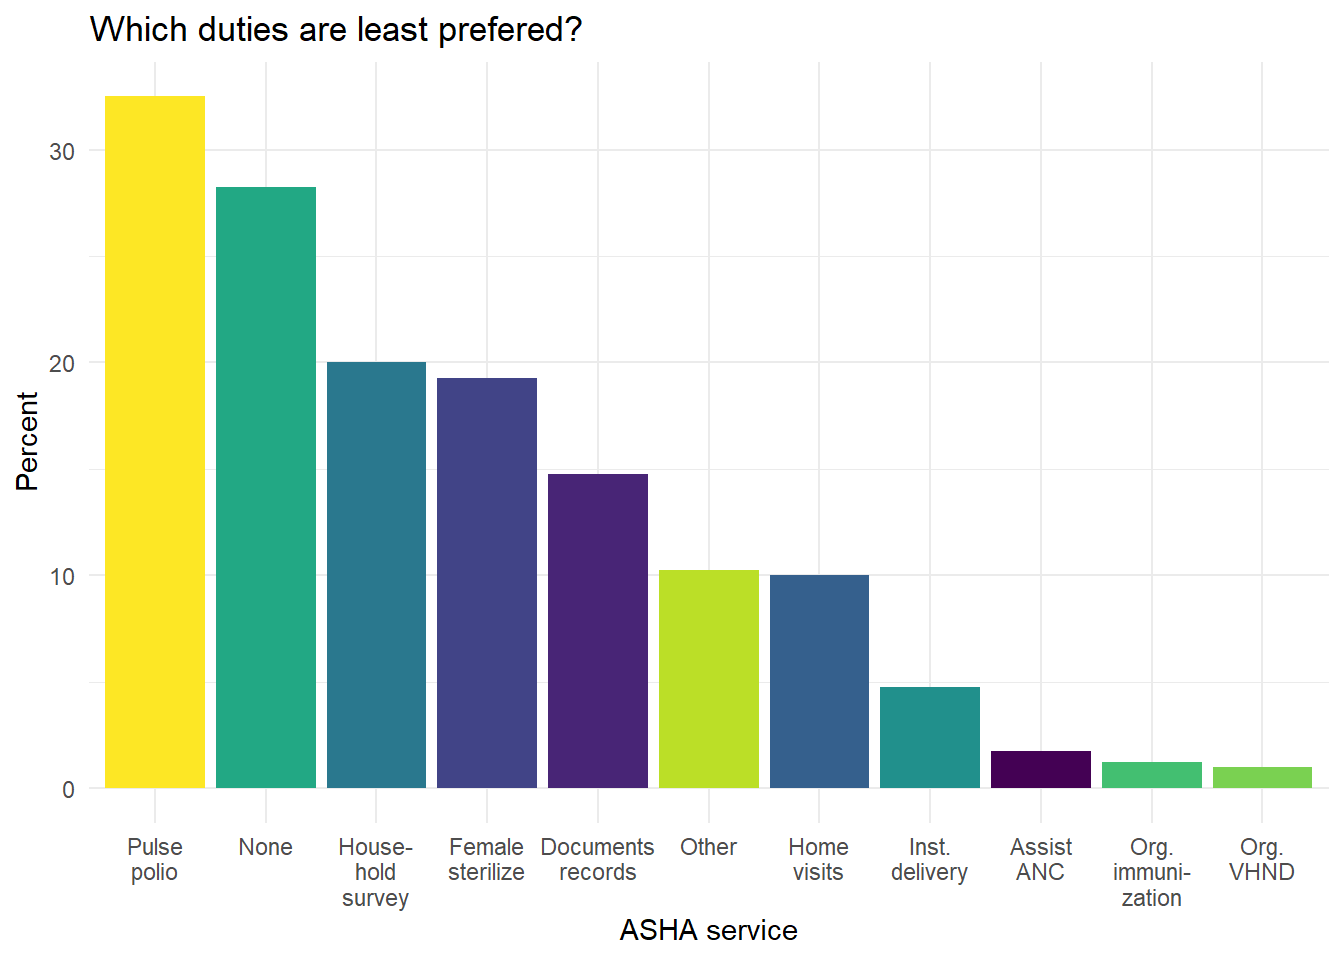
Figure 6.24: Which services do ASHAs say they prefer the least?
The reasons for some services to be preferred less by ASHAs are, most prominently, that they are cumbersome, second that they have less incentives, and third that they are less interesting (Figure 6.25).
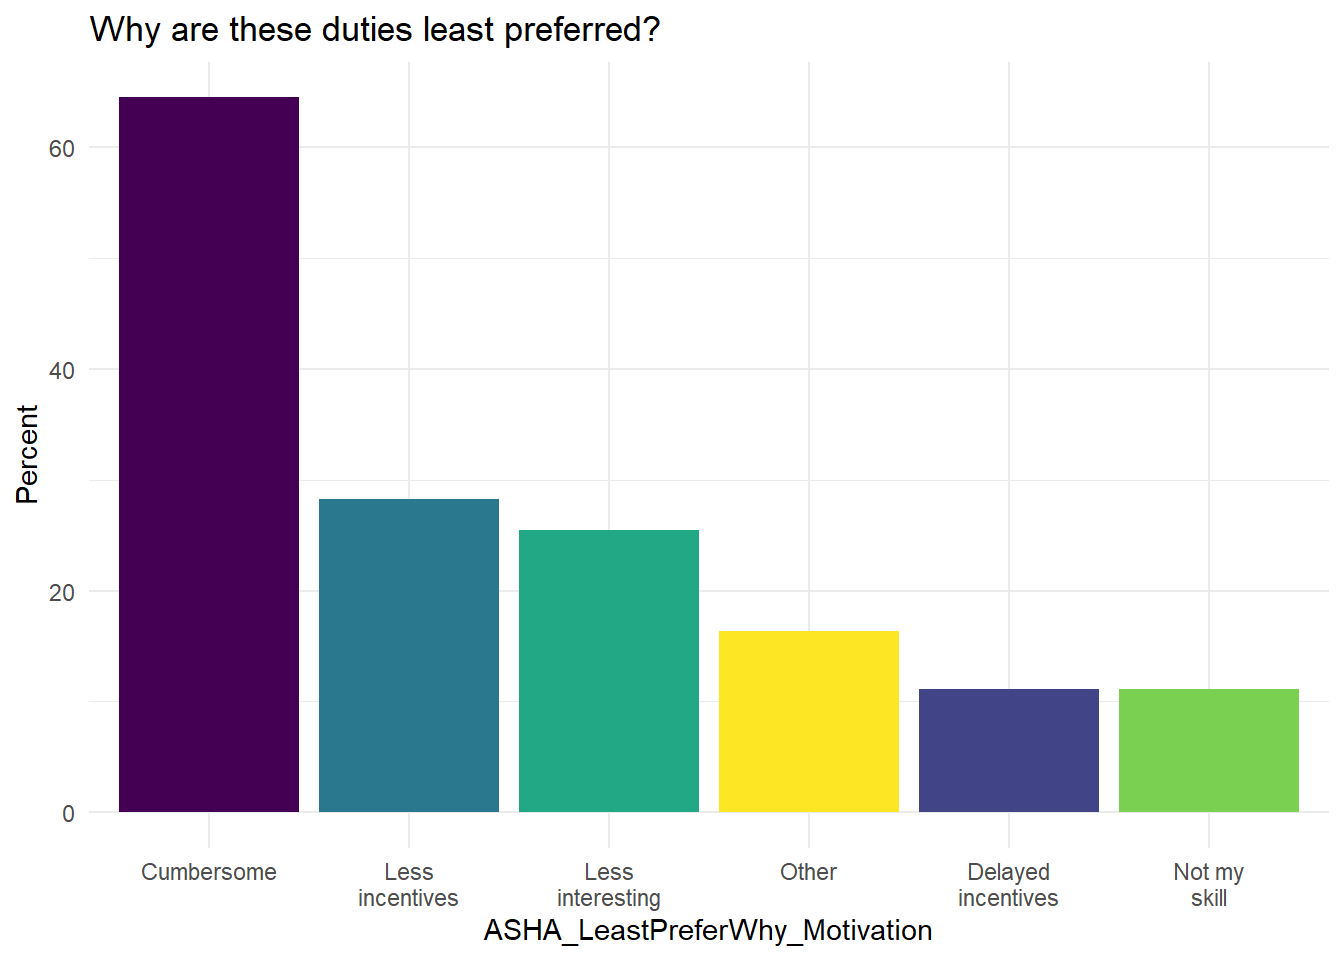
Figure 6.25: What are the reasons why ASHA do not prefer the least-preferred services?
Take-home message
For our ongoing discussion about extrinsic and extrinsic motivations, we find that payment incentives and factors like the interest or annoyance associated with the task are among the most commonly stated for determining preference. This further suggests that it is rarely one or the other and that ASHA extrinsic and intrinsic motivators are highly intertwined.
Incentives play a major role in regulating ASHA’s preferences for different services, however the structure, complexity, and breadth of certain services can lead to them having low preference in spite of being incentivized. For instance, among the the least preferred services are pulse polio and household surveys, both of which highlight the imbalance between ASHA’s bandwidth and the workload. Other lower preference services like Family Planning and Documentation highlight the complexity and lack of skills for ASHAs to manage such services.
6.5.2.2 Are incentivized tasks more preferred?
We first compare the rank of each task to the median estimate of its value in incentive amount and then rank the tasks by the number of times they were voted the most preferred and then by the number of times they were voted as the least preferred.
| Service | Median | rank |
|---|---|---|
| Institutional delivery | 600 | 1 |
| Tuberculosis- identification & treatment [cat-1] | 600 | 1 |
| Pulse polio | 450 | 3 |
| Female sterlization | 300 | 4 |
| Filaria- identification & referral | 300 | 4 |
| Male sterlization | 300 | 4 |
| Post-natal home visits | 250 | 7 |
| Immunization [vhnd session] | 175 | 8 |
| Ppiucd | 150 | 9 |
| Complete immunization [one year] | 100 | 10 |
| Leprosy treatment & identification | 100 | 10 |
| Lbw identification/sam management | 99 | 12 |
| Malaria treatment & identification | 99 | 12 |
| Registration of pregnant women/anc | 99 | 12 |
| Tt injections | 99 | 12 |
| Ifa tablets | 77 | 16 |
| Most preferred service | count | rank |
|---|---|---|
| Org. immunization | 369 | 1 |
| Inst. delivery | 353 | 2 |
| Home visits | 220 | 3 |
| Female sterilize | 179 | 4 |
| Assist ANC | 168 | 5 |
| Documents records | 89 | 6 |
| Other | 74 | 7 |
| Pulse polio | 64 | 8 |
| Household survey | 38 | 9 |
| Org. VHND | 38 | 9 |
| None | 3 | 11 |
| Org. com events | 3 | 11 |
| Least preferred service | count | rank |
|---|---|---|
| Pulse polio | 130 | 11 |
| None | 113 | 10 |
| Household survey | 80 | 9 |
| Female sterilize | 77 | 8 |
| Documents records | 59 | 7 |
| Other | 41 | 6 |
| Home visits | 40 | 5 |
| Inst. delivery | 19 | 4 |
| Assist ANC | 7 | 3 |
| Org. immunization | 5 | 2 |
| Org. VHND | 4 | 1 |
Across these three tables we see that some of the higher paying incentives, like institutional delivery, are fairly highly ranked for most preferred service (second) and rarely named for least preferred service. However, Pulse Polio has one of the highest incentive amounts and received the most votes for least preferred service. Home visits and assisting the ANC are both highly ranked and unincentivized.
Examining these ranks makes it clear that incentive amounts are not the only factor determining preference.
6.5.2.3 What do ASHAs do with the incentives?
We also asked ASHAs about what they do with the incentive payments they receive because spending behavior may indicate aspects of the underlying motivations for taking the job or what factors present unseen challenges. A follow-up question asked what ASHAs direct their incentive money toward and 96.3% reported that they make financial contributions to their household, with 66.2% saying that all of their earnings go to the household and 27.5% saying that they give more than half.
The most common areas where ASHAs direct their incentives is toward child education and daily chores (Figure 6.26) (daily chores includes spending on groceries and household items).
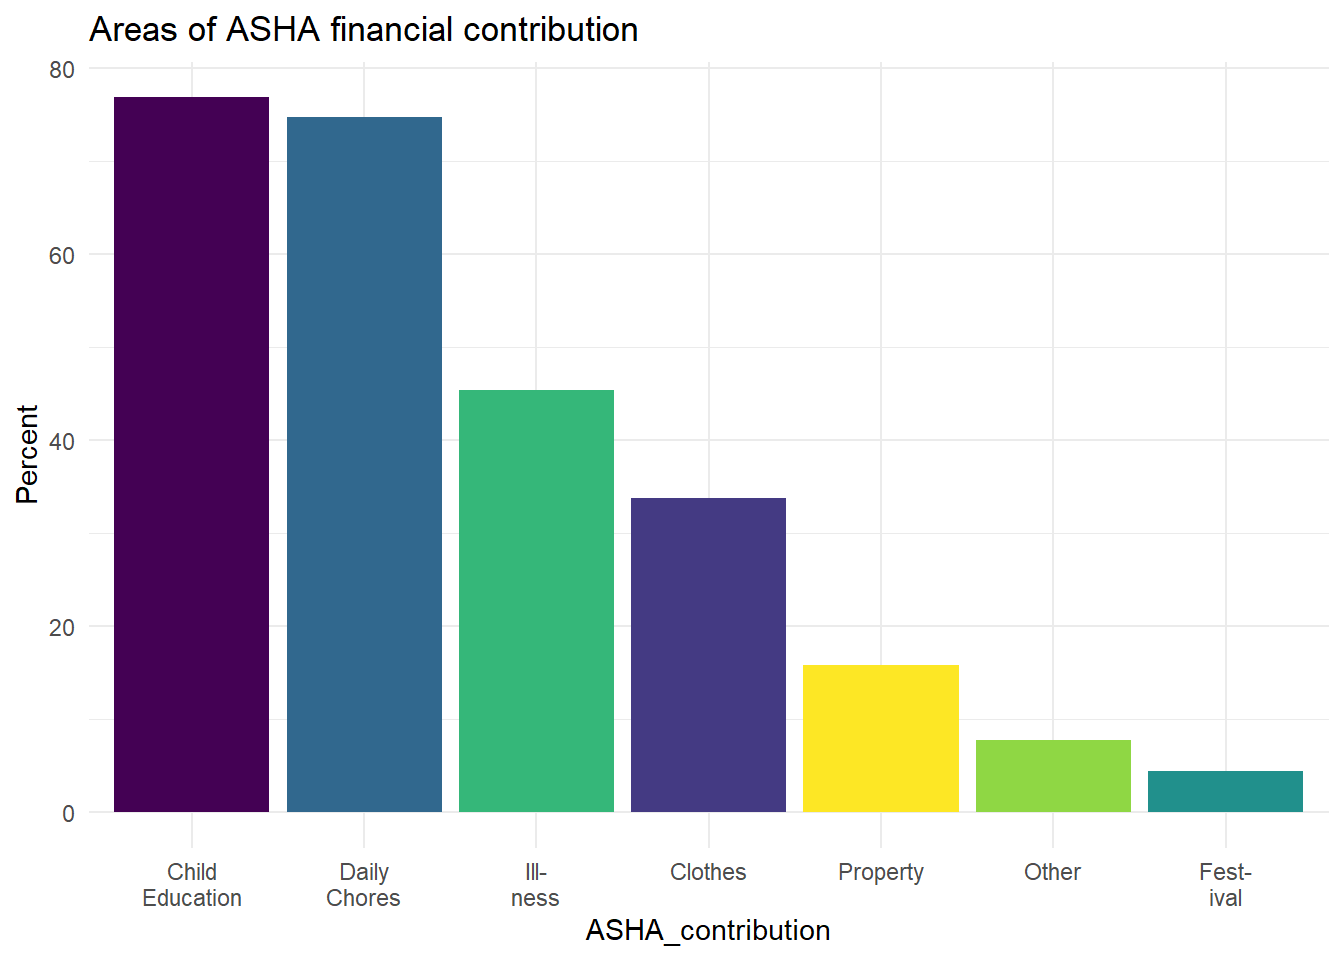
Figure 6.26: Where ASHAs report directing their financial contributions (of the 385 of 400 ASHAs who said they direct financial contributions to the household).
When asked why ASHAs wanted to become ASHAs in the first place: they respond that they want to serve their community and that they want to earn money (these are the two most common responses, both mentioned by over 60% of ASHAs’, Figure 6.27).
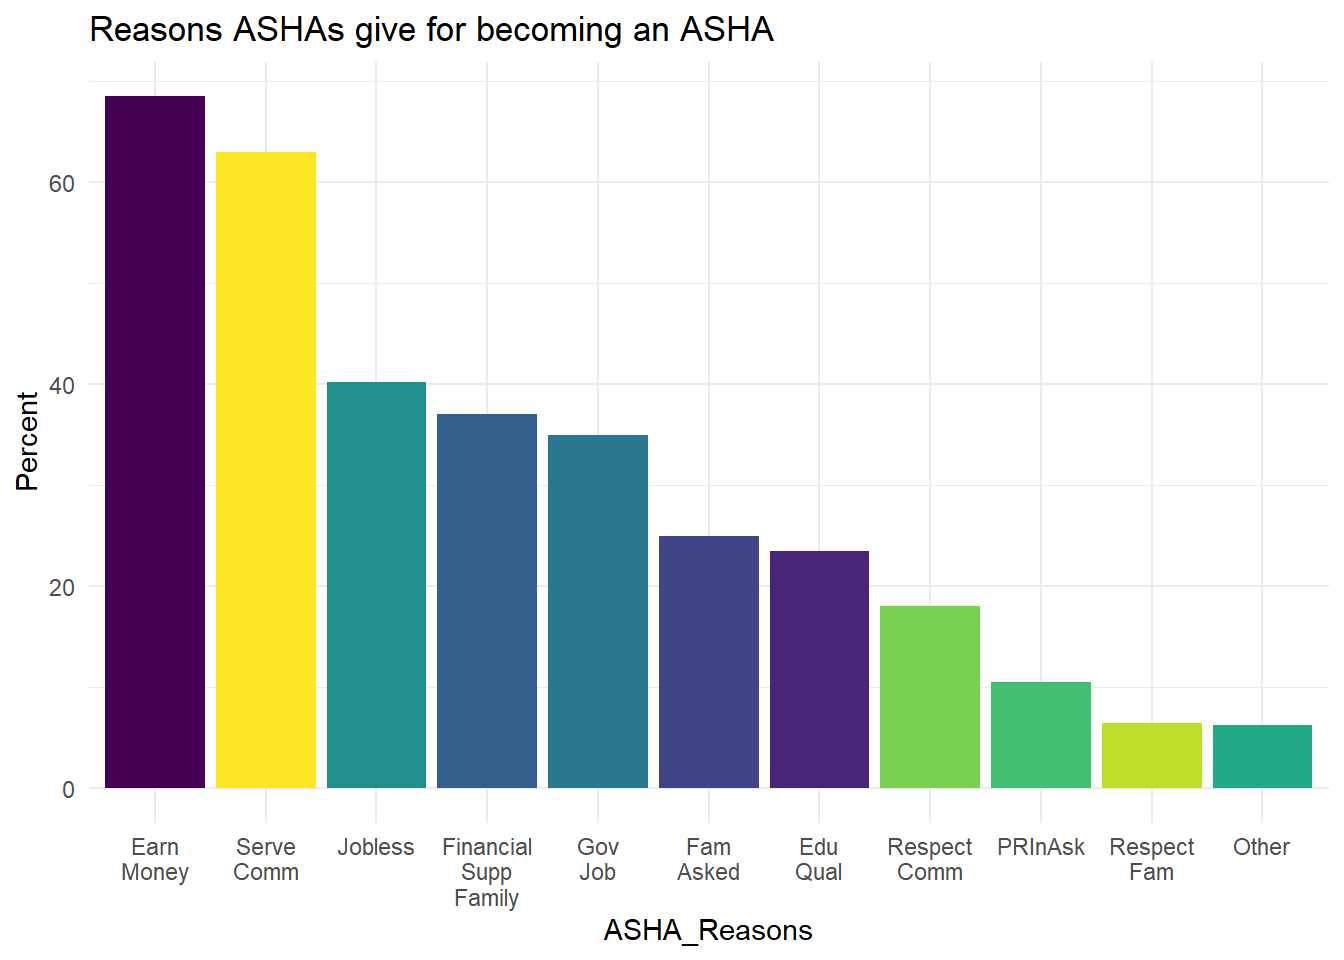
Figure 6.27: Reasons ASHA report for why they became ASHAs
We also grouped some of these motives together to look for broader patterns. Some of the responses cover similar themes and individuals can select multiple responses for most questions.
We did this grouping exercise in two ways.
First, we looked at just the two most common responses to the question of ‘why did you become an ASHA?’ , which were: a) ‘to serve the community’ and b) ‘to earn money.’
While these responses were common, they are both desirable and it is possible that most ASHAs selected both. In fact, 183 (46%) selected both, 23% said to earn money but didn’t mention serving the community, 17% said to serve the community but didn’t mention earning money.
Second, we looked at all of the responses, as opposed to just the two most common. In this case we grouped any response that could have a financial motive into one group and any that related to respect or service into another. * The ‘financial’ responses included: financial support for family, a government job, jobless (unemployed), and to earn money. * The ‘respect and service’ options included: serving the community, for community respect, and for family respect.
In this case 232 (58%) selected motives from both of these categories, 30% selected only from a financial motivator, and 9% from only a service or respect motivator. From this perspective 88% of ASHAs included some kind of financial motivation in their self-reported account of why they became an ASHA.
Take-home message
Intrinsic and extrinsic motivations are both important for ASHAs. It may be the case that extrinsic factors, like the payment system, interact with the intrinsic ones, like a desire to support one’s family or serve the community. Clearly the need for remuneration is an aspect of ASHA motivation.
While financial motivations are clearly important to most ASHAs, most of those ASHAs allocate the money they earn directly to the household.
Payment amounts and wait times are uncertain and this may affect the relationship between ASHAs and the health system; it could affect trust.
The financial support that ASHAs can provide seem to be crucial for family well-being. Their earnings are used for everyday expenses, which may help ensure the ability to apply other household incomes for long term investments like building the house or buying a vehicle. This can be indirectly inferred from the socio-economic data for the ASHAs. ASHAs are important financial contributors, but may not have similar agency compared to their husbands.
Issues with the incentives is one of the biggest challenges ASHAs face from the health system. However, haphazard planning and paperwork are also prominent challenges faced by the ASHAs. Some other issues ASHAs mentioned include lack of training, sudden changes in responsibilities, and lack of supplies.
6.5.3 ASHA Support
In both the ethnography and the qualitative data the importance of supportive family members is mentioned my ASHAs. To evaluate these observations further we look at the quantitative data on support ASHAs receive from family members and from other CHWs.
6.5.3.1 Family Support
In order to complete the duties listed above, ASHAs often receive support from family members.
When asked about sources of support 30% of ASHA households reported that Mothers-in-law care for the ASHA’s children while she works, 33.5% said the husband does, and 44.8% said her older children.
The most commonly stated family-level challenge stated by ASHA was difficulty completing household chores, but 65.3% of ASHAs said they didn’t face any family level challenges due to the job.
6.5.3.2 Support from CHWs
ASHAs also have the potential to draw on their professional peers for support, from other ASHAs to other CHWs.
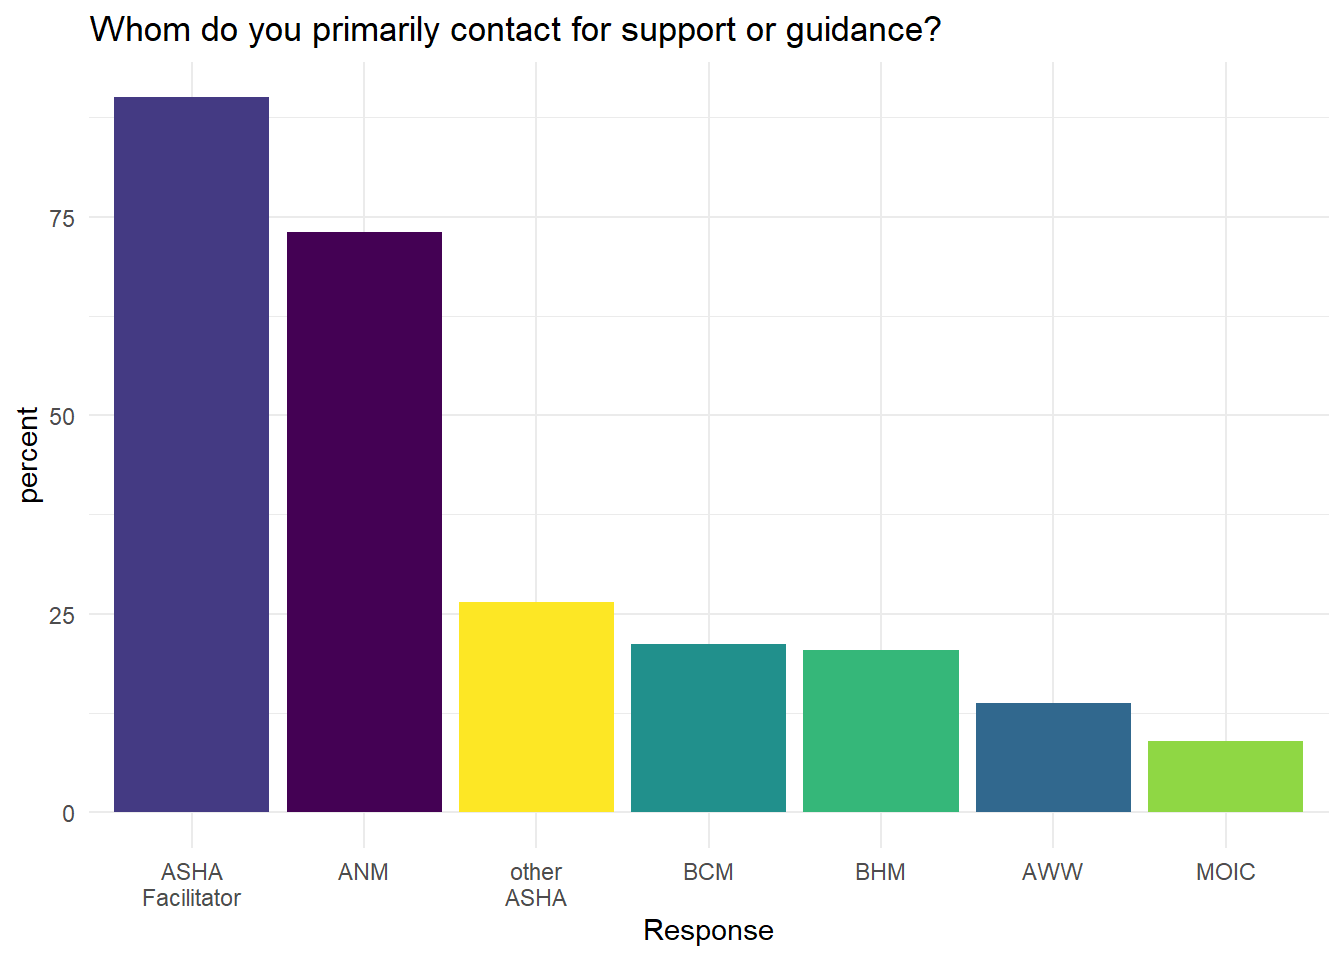
Figure 6.28: Who ASHAs contact for help or guidance
The main sources for this help, according to ASHA self-reports, are the ASHA facilitator, ANMs, and other ASHAs. However, other ASHAs are relied upon for help much less often than the other two.
ASHAs report that they have generally positive relationships with all three of these sources of guidance. Over 80% say they receive a lot of respect from ASHA supervisors and the main reason they reach out for help is with documentation and record keeping.
With ANMs, on the other hand, the main topic discussed was vaccinations (~89% of ASHAs), but record keeping was second (56%).
ASHAs frequently use mobile phones to communicate with other CHWs.
With other ASHAs:
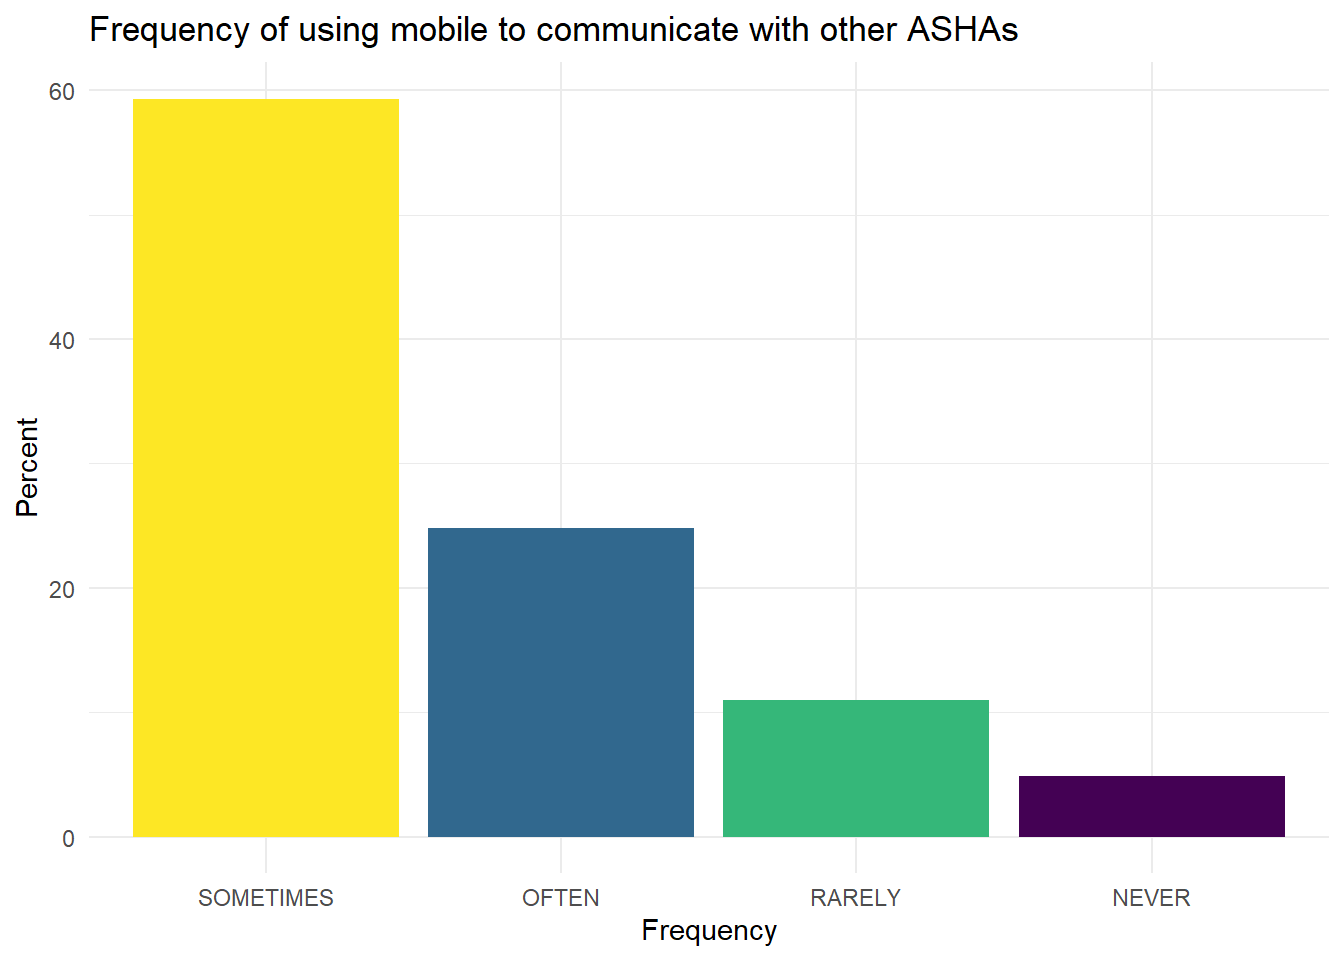
Figure 6.29: Mobile phone for ASHA to ASHA communication.
With ANMs:
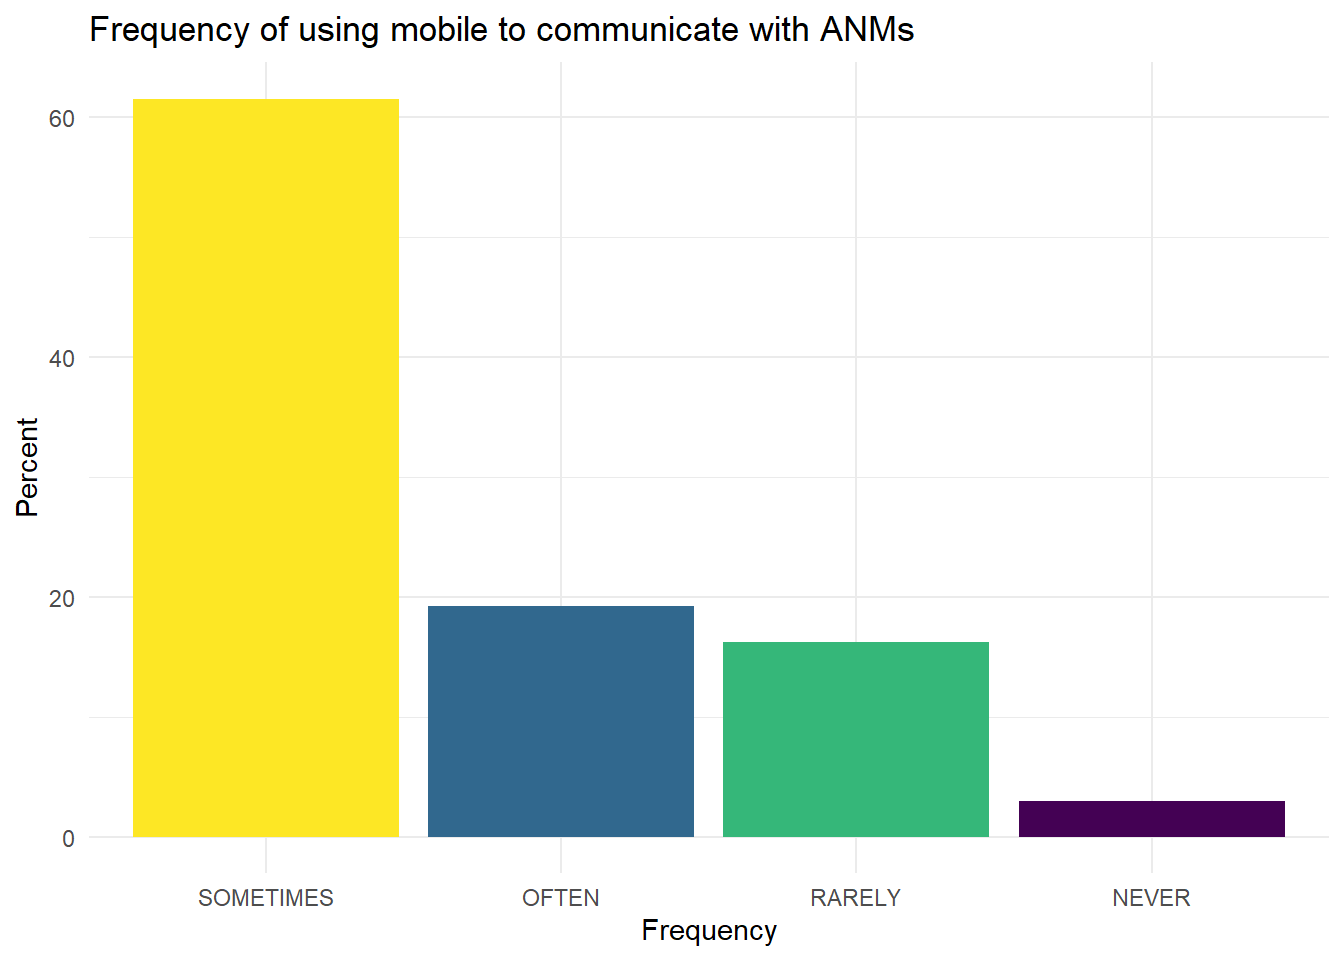
Figure 6.30: Mobile phone for ASHA to ANM communication.
The most common responses are sometimes or often in both bases.
Phones are popular tools for communication. However, ASHAs use cellphones primarily for calling others and internet-based services are still rarely used.
ASHAs collaborate with other ASHAs to provide their services. The topics they most often reach out to each other for are documentation and registers. Other collaborations include discussing new assignments and assisting in facility related services.
ASHAs also interact with ANMs, but primarily during VHND/Routine Immunization Day. Interactions with ANMs tend to be on more technical topics, like immunization and the associated record keeping.