7.5 ASHA Interaction and Overall Uptake of Biomedical Behavior
We have looked at a series of health related behaviors. Here, we want to see if mothers who interacted with ASHAs more often were more likely to engage in healthy behavior. To do this we look at the number of the biomedically recommended behaviors that each woman engaged in (meaning that their ‘yes’ and ‘no’ responses were consistent with biomedical recommendations for the 11 behaviors we looked at so far). We then take the count of the number of behaviors a woman engages in the recommended direction and examine the correlation between this count at the ASHA interaction score.
Here is the resulting figure (the points in the plot are jitter-ed and semi-translucent to make them more visible):
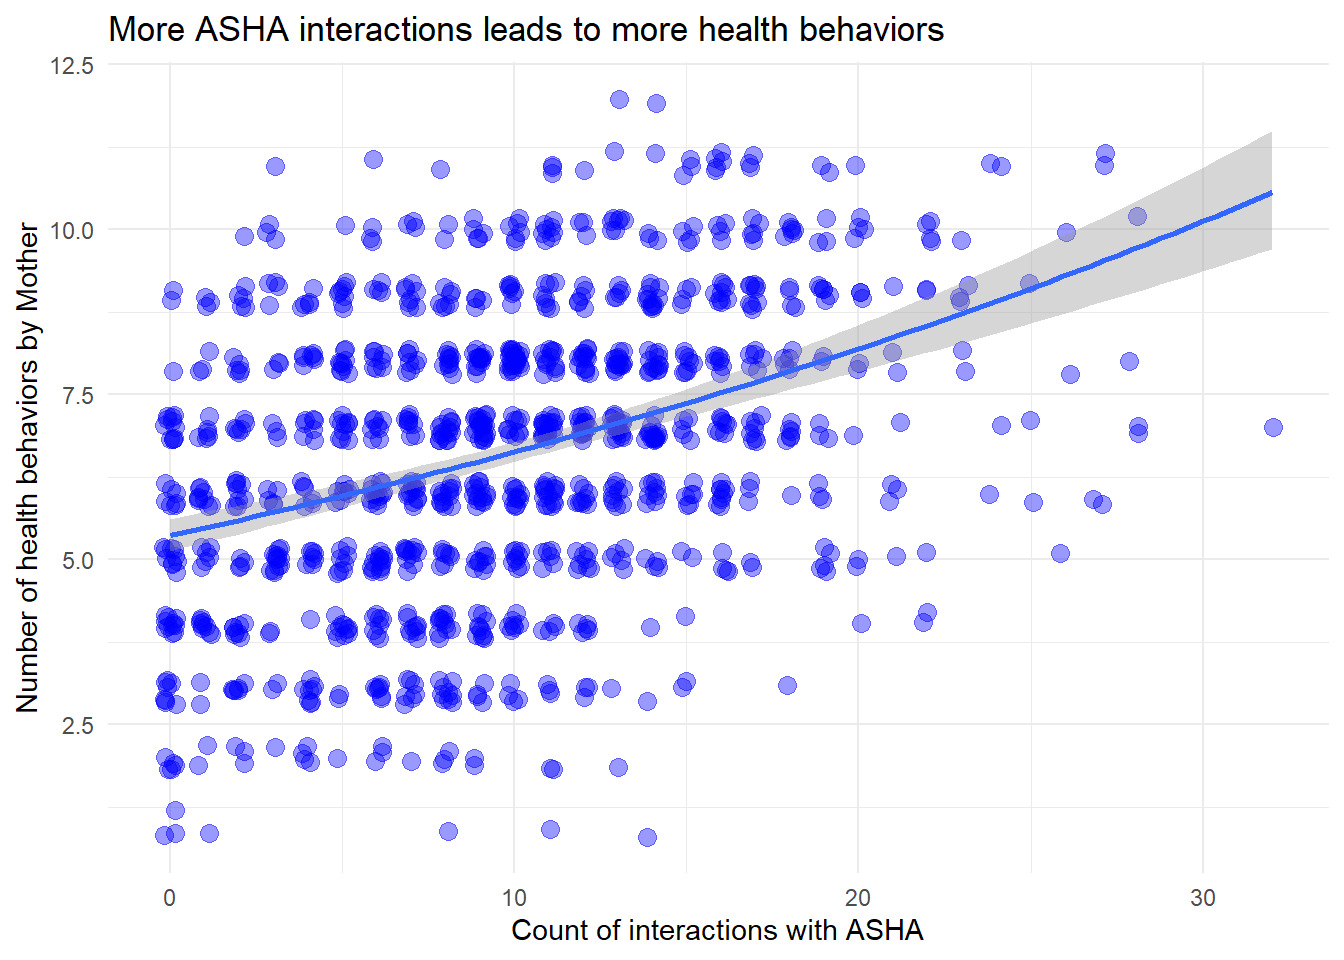
Figure 7.10: The relationship between mother health score and ASHA interaction score.
The slope of the above line is is 0.020 and is significant by conventional standards (generalized linear model with negative binomial because the response is count data and it is under-dispersed, P < 2e-16). The figure shows that increased ASHA interaction leads to higher uptake of health behavior.
7.5.1 Component parts of ASHA Interaction Score
How many women are having limited contact with the ASHA?
7.5.2 Factors Predicting Greater ASHA Interaction Scores
Increased interaction with ASHAs leads to greater uptake of recommended behaviors. Here we are interested in individual-level characteristics that may affect the frequency of these interactions.
What characteristics are linked to more ASHA interaction?
| expEst | Estimate | Std. Error | t value | Pr(>|t|) | |
|---|---|---|---|---|---|
| (Intercept) | 8.179 | 2.102 | 0.073 | 28.928 | 0.000 |
| ageclass21-24 | 1.045 | 0.044 | 0.059 | 0.736 | 0.462 |
| ageclass25-28 | 1.141 | 0.132 | 0.075 | 1.757 | 0.079 |
| ageclass29-33 | 1.165 | 0.153 | 0.093 | 1.639 | 0.101 |
| ageclass34+ | 1.167 | 0.155 | 0.123 | 1.253 | 0.210 |
| ageclass_married15-17 | 1.113 | 0.107 | 0.063 | 1.684 | 0.092 |
| ageclass_married18-20 | 1.141 | 0.132 | 0.068 | 1.952 | 0.051 |
| ageclass_married21+ | 1.029 | 0.028 | 0.114 | 0.248 | 0.804 |
| nkidscat2 | 0.956 | -0.046 | 0.059 | -0.767 | 0.443 |
| nkidscat3 | 0.988 | -0.012 | 0.071 | -0.171 | 0.864 |
| nkidscat4 | 1.023 | 0.023 | 0.085 | 0.271 | 0.787 |
| nkidscat5+ | 0.896 | -0.109 | 0.103 | -1.057 | 0.291 |
| m_educat1to7 | 1.066 | 0.064 | 0.061 | 1.044 | 0.297 |
| m_educat8to10 | 1.031 | 0.031 | 0.052 | 0.600 | 0.548 |
| m_educat11to13 | 1.057 | 0.055 | 0.076 | 0.720 | 0.472 |
| m_educat14to17 | 1.184 | 0.169 | 0.089 | 1.905 | 0.057 |
In this first model (Table 7.8), we see that women with intermediate ages-at-marriage (15 - 17 and 18 - 20) had higher ASHA interaction scores than women with the earliest ages of marriage (10 - 14). Women in the highest education category (14 - 17 years) had more ASHA interaction than those in the lowest category (0 years).
| expEst | Estimate | Std. Error | t value | Pr(>|t|) | |
|---|---|---|---|---|---|
| (Intercept) | 8.288 | 2.115 | 0.096 | 22.024 | 0.000 |
| ageclass_married15-17 | 1.119 | 0.112 | 0.063 | 1.786 | 0.074 |
| ageclass_married18-20 | 1.156 | 0.145 | 0.066 | 2.192 | 0.029 |
| ageclass_married21+ | 1.077 | 0.074 | 0.111 | 0.667 | 0.505 |
| m_educat1to7 | 1.049 | 0.048 | 0.061 | 0.782 | 0.434 |
| m_educat8to10 | 0.992 | -0.008 | 0.050 | -0.152 | 0.879 |
| m_educat11to13 | 1.006 | 0.006 | 0.074 | 0.078 | 0.938 |
| m_educat14to17 | 1.158 | 0.147 | 0.087 | 1.679 | 0.093 |
| castefSCHEDULED CASTE | 1.013 | 0.013 | 0.085 | 0.157 | 0.875 |
| castefSCHEDULED TRIBE | 1.335 | 0.289 | 0.155 | 1.861 | 0.063 |
| castefOBC | 1.058 | 0.057 | 0.080 | 0.708 | 0.479 |
In this second model we change the control variables in the model and include caste (Table 7.9). The same impression regarding age at marriage and education is present. There is also an indication of a somewhat unexpected result: that women in scheduled tribe may have slightly greater ASHA interaction scores than those in General.
| expEst | Estimate | Std. Error | t value | Pr(>|t|) | |
|---|---|---|---|---|---|
| (Intercept) | 8.511 | 2.141 | 0.057 | 37.843 | 0.000 |
| ageclass_married15-17 | 1.116 | 0.110 | 0.063 | 1.752 | 0.080 |
| ageclass_married18-20 | 1.155 | 0.145 | 0.065 | 2.211 | 0.027 |
| ageclass_married21+ | 1.062 | 0.060 | 0.108 | 0.554 | 0.580 |
| m_educat1to7 | 1.044 | 0.043 | 0.060 | 0.716 | 0.474 |
| m_educat8to10 | 1.004 | 0.004 | 0.050 | 0.084 | 0.933 |
| m_educat11to13 | 1.021 | 0.021 | 0.073 | 0.287 | 0.774 |
| m_educat14to17 | 1.172 | 0.159 | 0.087 | 1.824 | 0.068 |
| religfrecodeMUSLIM | 1.115 | 0.109 | 0.056 | 1.933 | 0.053 |
| religfrecodeOTHER | 1.154 | 0.144 | 0.216 | 0.664 | 0.507 |
In the next model we replace caste with religion and find that Muslim women may have slightly higher ASHA interaction scores than Hindu women.
| expEst | Estimate | Std. Error | t value | Pr(>|t|) | |
|---|---|---|---|---|---|
| (Intercept) | 7.760 | 2.049 | 0.114 | 17.962 | 0.000 |
| ageclass21-24 | 1.062 | 0.060 | 0.059 | 1.016 | 0.310 |
| ageclass25-28 | 1.167 | 0.154 | 0.075 | 2.070 | 0.039 |
| ageclass29-33 | 1.197 | 0.180 | 0.093 | 1.937 | 0.053 |
| ageclass34+ | 1.197 | 0.179 | 0.123 | 1.459 | 0.145 |
| ageclass_married15-17 | 1.106 | 0.101 | 0.063 | 1.608 | 0.108 |
| ageclass_married18-20 | 1.135 | 0.127 | 0.067 | 1.878 | 0.061 |
| ageclass_married21+ | 1.051 | 0.050 | 0.116 | 0.433 | 0.665 |
| nkidscat2 | 0.953 | -0.048 | 0.059 | -0.825 | 0.410 |
| nkidscat3 | 0.975 | -0.026 | 0.070 | -0.366 | 0.715 |
| nkidscat4 | 1.003 | 0.003 | 0.084 | 0.041 | 0.967 |
| nkidscat5+ | 0.870 | -0.140 | 0.103 | -1.356 | 0.175 |
| castefSCHEDULED CASTE | 1.041 | 0.040 | 0.088 | 0.453 | 0.651 |
| castefSCHEDULED TRIBE | 1.377 | 0.320 | 0.157 | 2.041 | 0.041 |
| castefOBC | 1.067 | 0.064 | 0.080 | 0.809 | 0.419 |
| religfrecodeMUSLIM | 1.139 | 0.130 | 0.059 | 2.195 | 0.028 |
| religfrecodeOTHER | 1.127 | 0.119 | 0.216 | 0.551 | 0.582 |
| m_educat1to7 | 1.078 | 0.075 | 0.061 | 1.223 | 0.221 |
| m_educat8to10 | 1.059 | 0.057 | 0.054 | 1.061 | 0.289 |
| m_educat11to13 | 1.112 | 0.107 | 0.080 | 1.331 | 0.184 |
| m_educat14to17 | 1.247 | 0.221 | 0.092 | 2.404 | 0.016 |
| wealthquintilesSecond | 0.938 | -0.064 | 0.061 | -1.046 | 0.296 |
| wealthquintilesMiddle | 0.978 | -0.022 | 0.063 | -0.351 | 0.726 |
| wealthquintilesFourth | 1.029 | 0.029 | 0.065 | 0.440 | 0.660 |
| wealthquintilesRichest | 0.862 | -0.148 | 0.073 | -2.044 | 0.041 |
Lastly, a final model for this section includes wealth, caste, and relgion, along with the previous controls (Table 7.11). This model reproduces previous impressions for age at marriage, Scheduled Tribe, being Muslim, and education, and also suggests that the wealthiest category interacts with ASHAs less than the lowest wealth category.
Identifying precisely what predicts greater levels of ASHA interaction will need more investigation, but from this exploratory exercise we have a few general impressions. Intermediate levels of age and age at marriage lead to more ASHA interaction. There is some indication that being in the wealthiest quintile reduces ASHA interaction and that being in the most educated subgroup leads to more ASHA interaction. Muslim women have greater ASHA interaction scores than Hindu women (note, the ethnography suggested that some ASHAs may look down on majority Muslim villages or areas).
Take-home message
The ASHA interaction score is a sum that includes the number of visits reported in each trimester and post partum, and each time a woman references an ASHA as being responsible for a service in a followup question (Table ??).
The score is used as a measure of ASHA interaction to see if more interactions are correlated with adherence to recommended health behaviors as well as to see if some factors, such as differences between ASHA and beneficiary, limit interactions.
The more years of experience ASHAs have the more respected they are within the community. However, it is important to note that ASHAs begin at a high level of initial respect in their first years on the job, which potentially refers to the community’s generally high regard for and acceptance of the ASHA program (apart from an ASHA’s individual efforts throughout their years at the job)
Many mothers do not receive any postnatal visits by the ASHAs despite incentives for these visits. This seems like a potential area of concern, as a majority of newborn and maternal morbidity and mortality occur during this period, which requires a higher level of care and attention by the ASHAs. It is also a missed opportunity because it is an important life event marked with several rituals and traditional practices that ASHAs can augment with health advice for higher impact.