8.3 Quantifying Influencer Effects
The previous section reports associations between mentions and each behavior. These give an impression for salience: how readily is a source of influence associated with each behavior in the minds of women as they recall their most recent pregnancy. However, they do not tell us about the actual effect of each influence on actually doing the behavior. For instance, if Family is mentioned readily because they are commonly a source of influence on personal decisions, it could be misleading about the role they play in actually shaping the behavior.
To make statistically sound inferences about relationships between influencer and behavior we used a logistic regression model that included all biomedical questions, each influencer, the interactions between question and influencer, and several control variables. We then used a model selection procedure to find a final model that included only the set of interactions needed for the best fitting model. We used the result of this process to estimate predicted probabilities of doing each behavior given each source of influence.
The detailed methods of this process are presented in the following section in a gray box. Readers less interested in the nuts-and-bolts of the process may want to skip to the next section
8.3.1 Methods for Building Statistical Model of Health Behavior
In this box we present the process and output for developing the statistical model used to develop the Influencer Probability calculations.
We use a logistic regression and a model selection procedure to evaluate the overall effect of each influencer on each biomedical behavior. This model is used to estimate probabilities for engaging in each behavior according to the biomedical recommendation. The response variable (dependent variable) in these regressions is the yes/no answer for each of the biomedically relevant questions, with each question as a categorical variable in the regressions.
The control variables in the model are: age (categorical, with different categories for each dataset: Mothers and ASHAs), age at marriage (only included in model for Mothers), parity (categorical and based on number of total children at time of interview), education (categorical, with different categories for each dataset), wealth (categorical, measured as quintiles based on a principle component analysis). Descriptions for each of these variables can be found in Chapter 6.
These controls were included in addition to the categorical variable for each question and a binary variable for each influencer. Note that participants could report multiple influencers for each question. In the analysis the dummy coding is simply a ‘1’ if the influencer is mentioned for that category and a ‘0’ if they are not mentioned.
The following table shows a randomly selected subset of rows from the total dataset for mothers to help illustrate how the data are formatted and modeled. Note that each question/behavior is a categorical variable and the response is yes/no and includes all the biomedical questions in the dataset. This allows us to look at several questions in one model. Also, recall that the questions that are not recommended to do, like fasting during pregnant or treating the umbilical cord stump with a treatment, have been reverse coded such that ‘1’ means ‘yes’ means ‘consistent with biomedical recommendations’ across all questions.
The procedure for fitting the model used the following steps (post cleaning and organizing of the dataset):
fit the full model in R (R Core Team 2021). By full model we mean each control variable, each binary variable for each influencer, the categorical variable for question, and all question by influencer interactions.
pass the result from step 1 through a model selection algorithm that iteratively considers interactions and drops those that do not improve the final model fit as evaluated by AICc (Second-order Akaike Information Criterion) using backward selection. This step uses an information-theoretic approach as developed in the R package MuMln (Barton 2020). We call the result of this process ‘the big model’ for short, because it replaced an earlier approach that fit a separate model for each individual behavior.
calculate variance inflation factors for the resulting model using R package car (Fox, Weisberg, and Price 2021). If individual variables have large effects inflating the variance of the model then they may be problematically correlated with other variables in the model. There are many recommendations for how large a variance inflation factor should be before it should be removed from a model. Our approach was to examine any variance inflation factors above 5.0 and to remove them sequentially starting with the maximum value. In the results we removed one very large vif associated with an interaction in each model, Mothers and ASHAs. After removing the interactions from each model there were vif values between 5 and 8 in each but these were retained because they were associated with influencer or behavior main effects, rather than with interactions.
use the resulting model to estimate predicted probabilities for each behavior - influencer pairing and report these in a heatmap-style figure.
estimate the effects of each influencer on each behavior on the probability scale (which accounts for controls and all interactions retained in the model during the AIC model selection process at step 2).
repeat these steps for each of the following datasets: ASHA biomedical behaviors, Mother biomedical behaviors, ASHA neutral behaviors, Mother neutral behaviors.
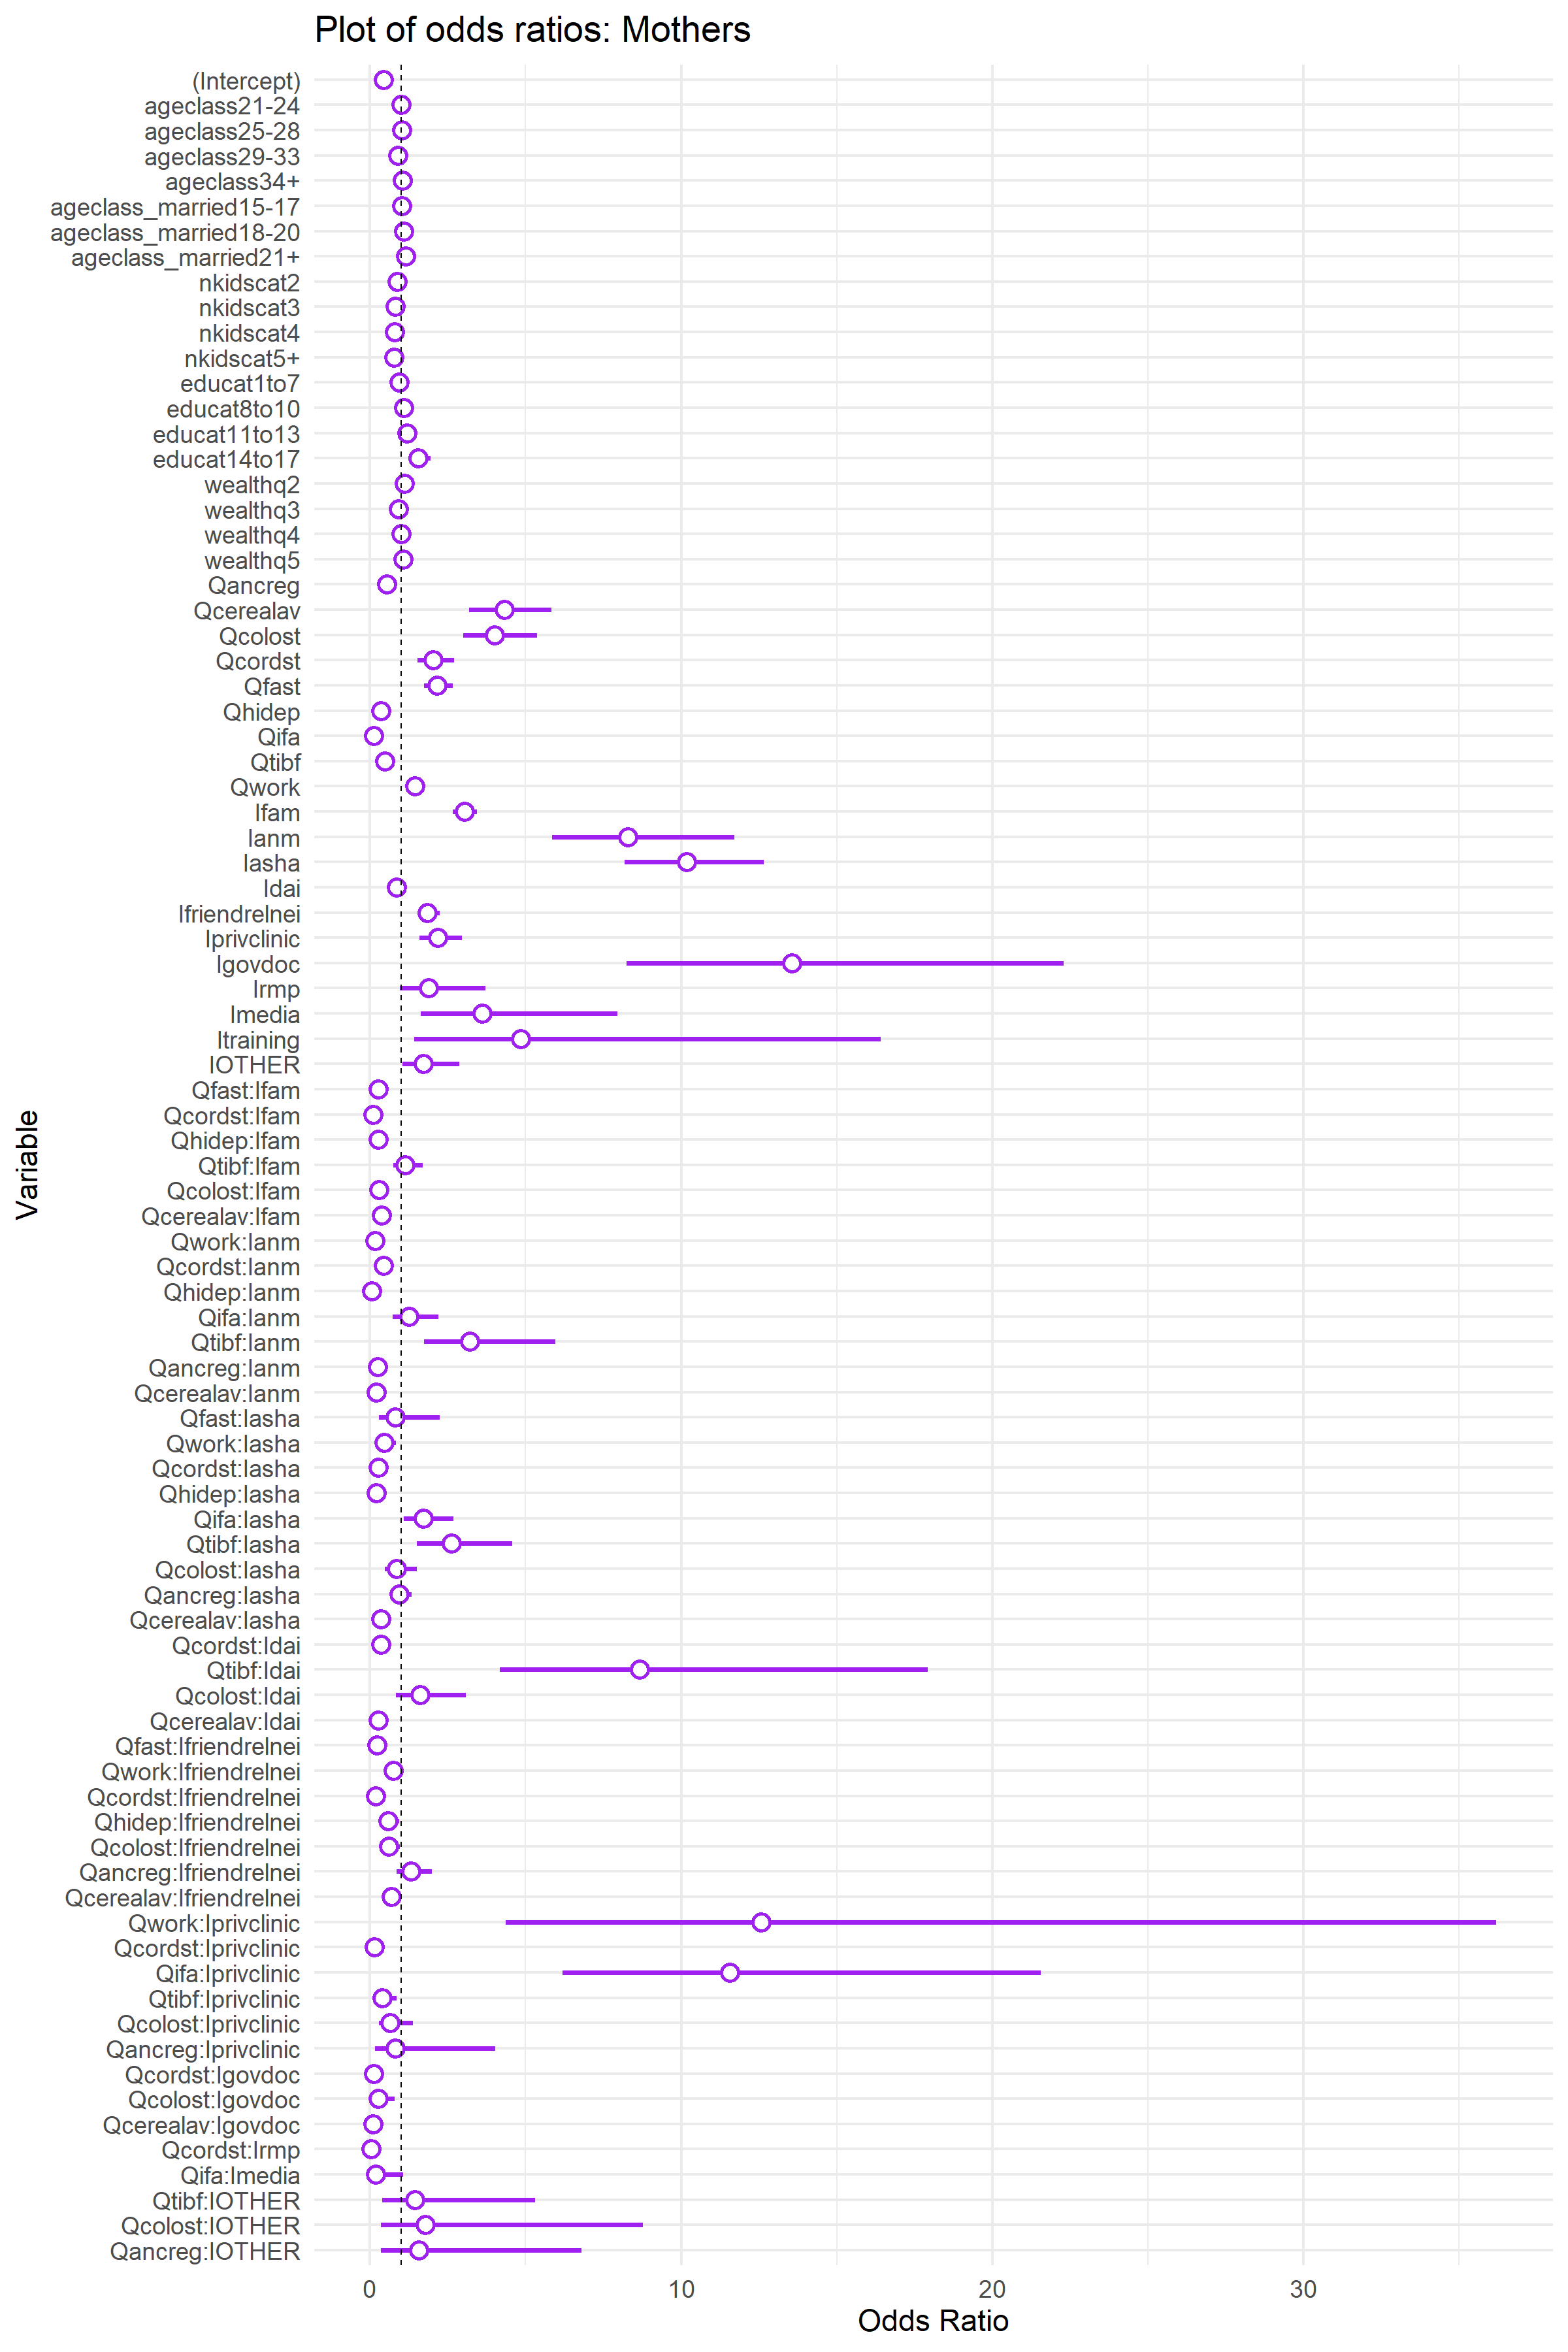
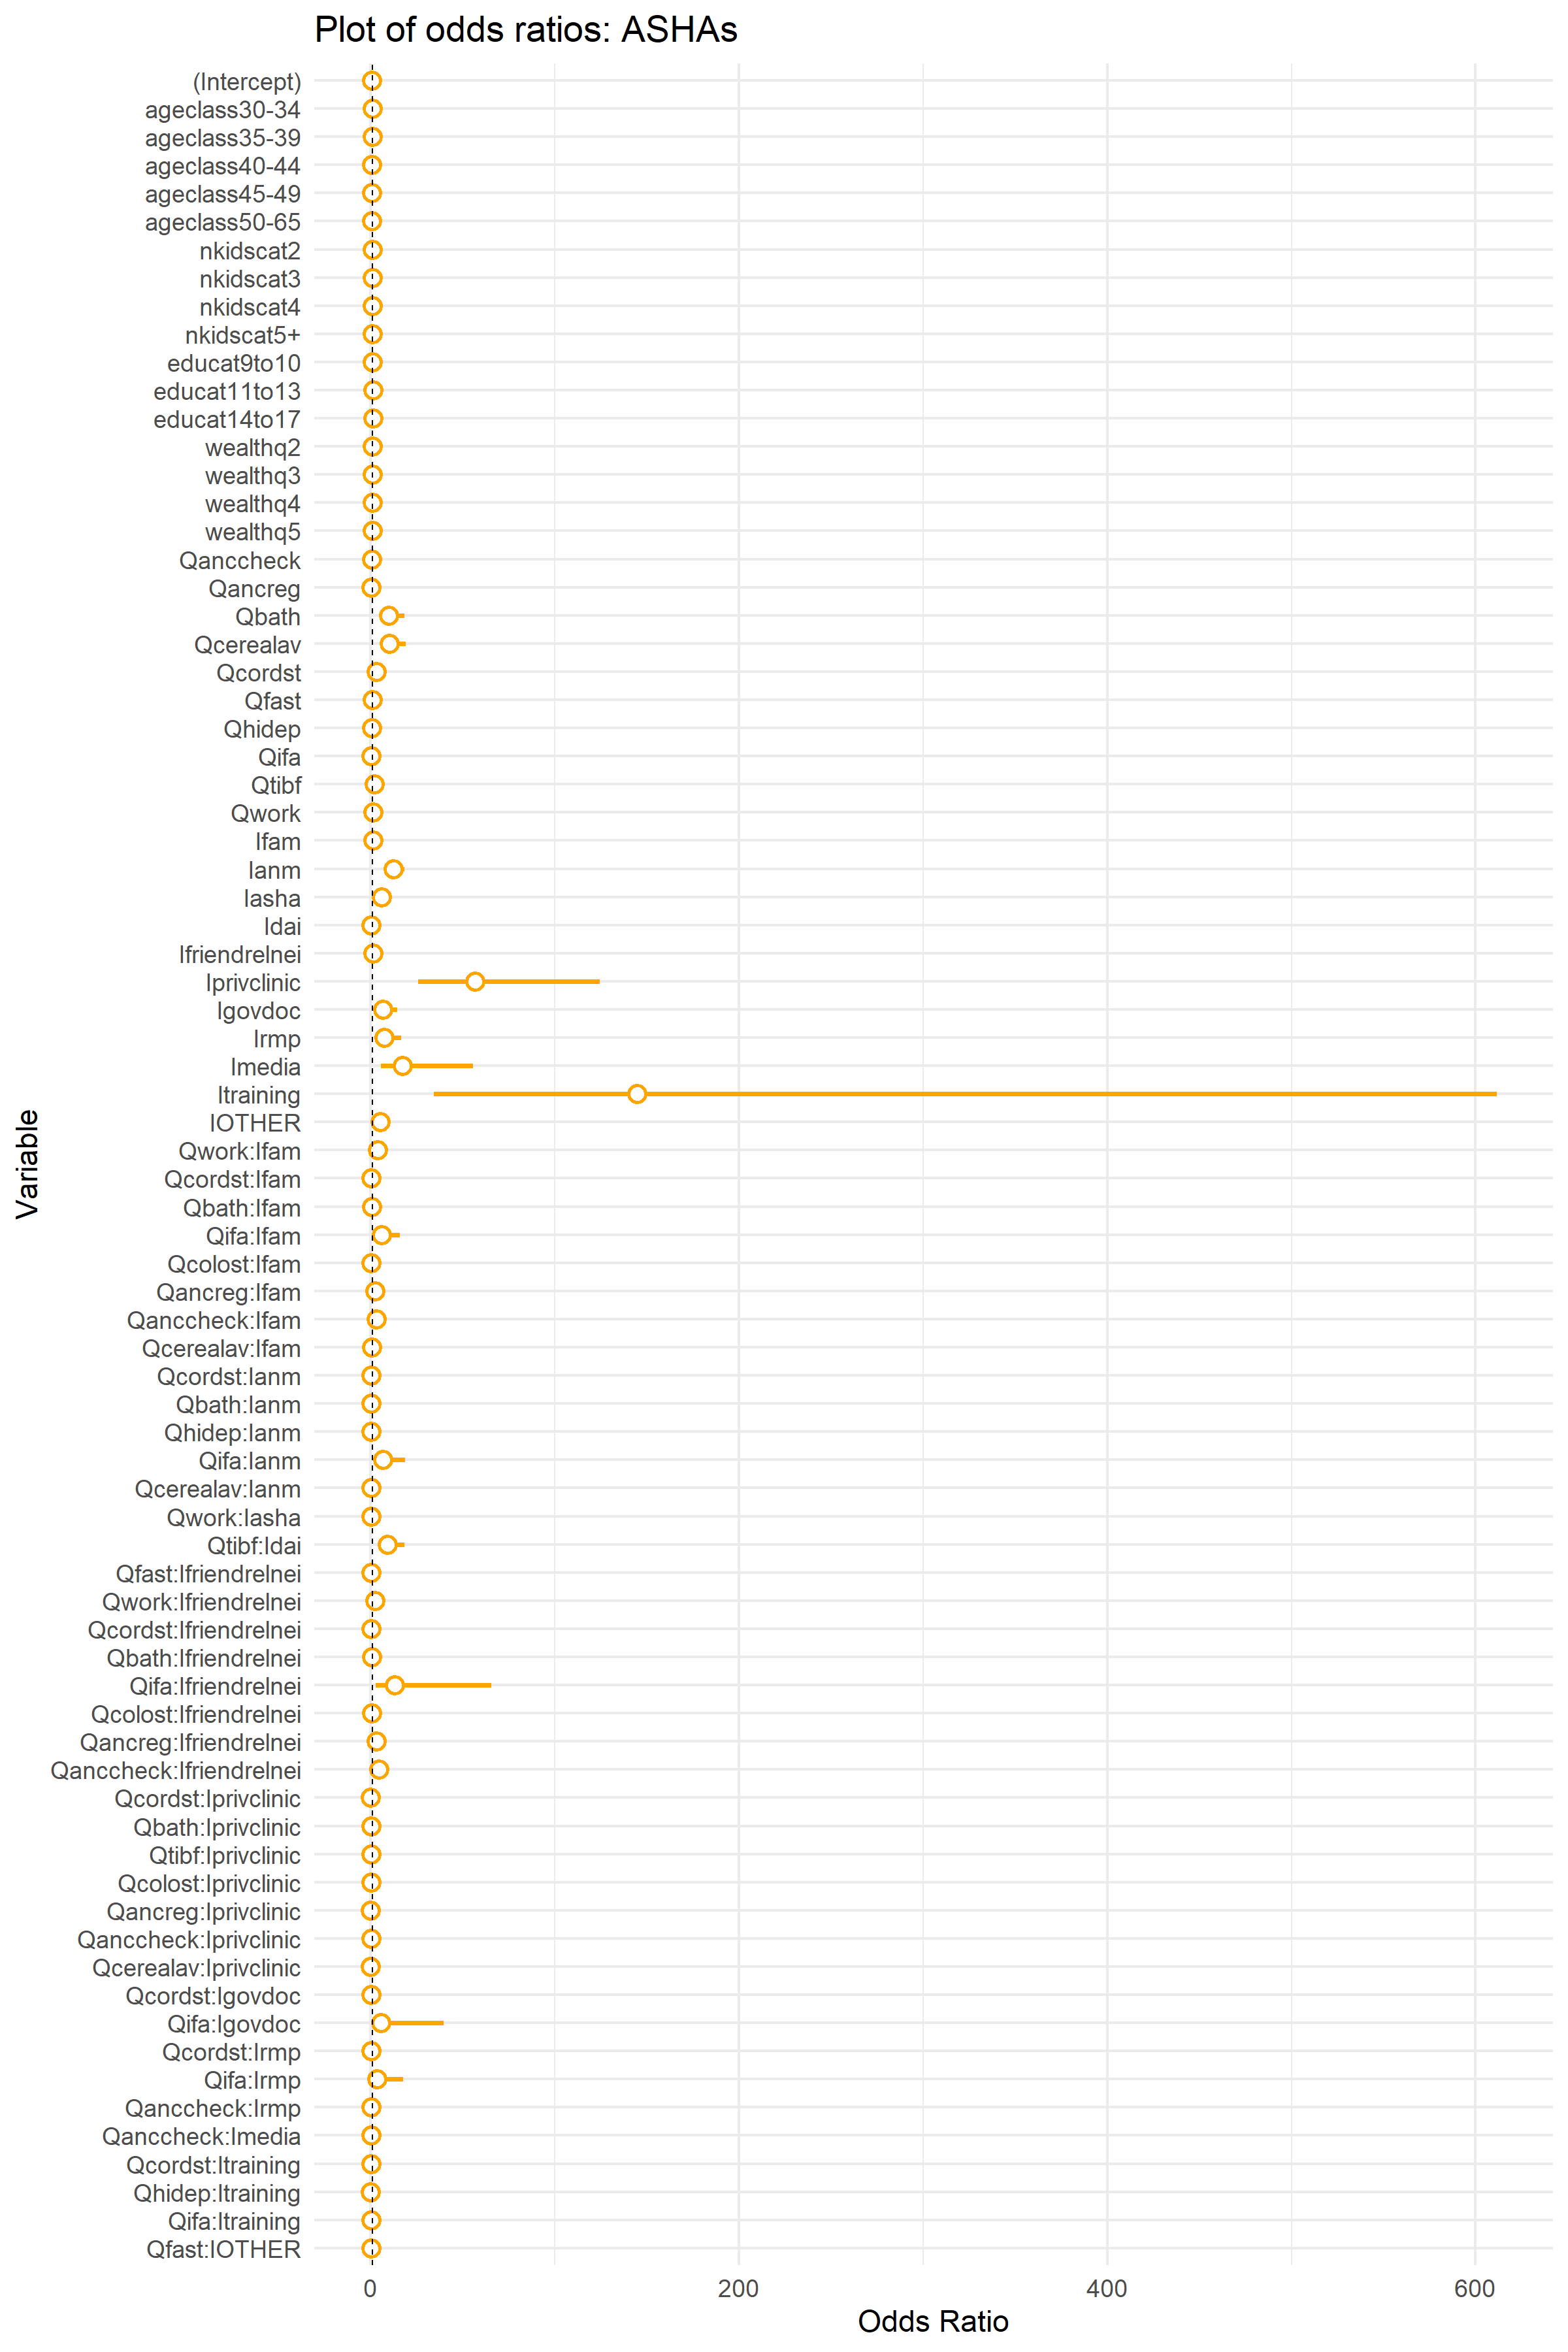
With that process complete, we report the final model results for each dataset, both as a table and as a figure showing the odd ratios and associated confidence intervals, along with the variance inflation factors.
Here is the ‘big model’ for the Mother data:
| expEst | Estimate | Std. Error | z value | Pr(>|z|) | |
|---|---|---|---|---|---|
| (Intercept) | 0.43 | -0.84 | 0.10 | -8.05 | 0.00 |
| ageclass21-24 | 1.00 | 0.00 | 0.07 | -0.07 | 0.94 |
| ageclass25-28 | 1.03 | 0.03 | 0.08 | 0.37 | 0.71 |
| ageclass29-33 | 0.90 | -0.10 | 0.11 | -0.94 | 0.35 |
| ageclass34+ | 1.05 | 0.05 | 0.14 | 0.36 | 0.72 |
| ageclass_married15-17 | 1.03 | 0.03 | 0.07 | 0.44 | 0.66 |
| ageclass_married18-20 | 1.08 | 0.08 | 0.07 | 1.09 | 0.27 |
| ageclass_married21+ | 1.14 | 0.13 | 0.13 | 0.97 | 0.33 |
| nkidscat2 | 0.87 | -0.13 | 0.07 | -2.02 | 0.04 |
| nkidscat3 | 0.81 | -0.21 | 0.08 | -2.64 | 0.01 |
| nkidscat4 | 0.80 | -0.23 | 0.10 | -2.33 | 0.02 |
| nkidscat5+ | 0.77 | -0.26 | 0.12 | -2.23 | 0.03 |
| educat1to7 | 0.94 | -0.06 | 0.07 | -0.85 | 0.40 |
| educat8to10 | 1.08 | 0.08 | 0.06 | 1.26 | 0.21 |
| educat11to13 | 1.20 | 0.18 | 0.09 | 1.90 | 0.06 |
| educat14to17 | 1.55 | 0.44 | 0.12 | 3.78 | 0.00 |
| wealthq2 | 1.11 | 0.10 | 0.07 | 1.46 | 0.14 |
| wealthq3 | 0.92 | -0.08 | 0.07 | -1.19 | 0.24 |
| wealthq4 | 1.00 | 0.00 | 0.07 | -0.03 | 0.98 |
| wealthq5 | 1.06 | 0.06 | 0.08 | 0.75 | 0.45 |
| Qancreg | 0.53 | -0.63 | 0.12 | -5.33 | 0.00 |
| Qcerealav | 4.31 | 1.46 | 0.15 | 9.47 | 0.00 |
| Qcolost | 4.01 | 1.39 | 0.15 | 9.30 | 0.00 |
| Qcordst | 2.03 | 0.71 | 0.14 | 4.96 | 0.00 |
| Qfast | 2.15 | 0.77 | 0.11 | 6.99 | 0.00 |
| Qhidep | 0.35 | -1.06 | 0.14 | -7.61 | 0.00 |
| Qifa | 0.12 | -2.10 | 0.16 | -12.79 | 0.00 |
| Qtibf | 0.47 | -0.75 | 0.15 | -4.97 | 0.00 |
| Qwork | 1.44 | 0.37 | 0.10 | 3.67 | 0.00 |
| Ifam | 3.03 | 1.11 | 0.07 | 16.91 | 0.00 |
| Ianm | 8.28 | 2.11 | 0.18 | 11.98 | 0.00 |
| Iasha | 10.17 | 2.32 | 0.11 | 20.83 | 0.00 |
| Idai | 0.86 | -0.15 | 0.15 | -0.97 | 0.33 |
| Ifriendrelnei | 1.85 | 0.62 | 0.10 | 6.48 | 0.00 |
| Iprivclinic | 2.17 | 0.77 | 0.16 | 4.89 | 0.00 |
| Igovdoc | 13.56 | 2.61 | 0.25 | 10.28 | 0.00 |
| Irmp | 1.89 | 0.63 | 0.35 | 1.83 | 0.07 |
| Imedia | 3.61 | 1.28 | 0.40 | 3.18 | 0.00 |
| Itraining | 4.85 | 1.58 | 0.62 | 2.54 | 0.01 |
| IOTHER | 1.72 | 0.54 | 0.26 | 2.09 | 0.04 |
| Qfast:Ifam | 0.26 | -1.36 | 0.14 | -9.53 | 0.00 |
| Qcordst:Ifam | 0.10 | -2.29 | 0.18 | -13.00 | 0.00 |
| Qhidep:Ifam | 0.26 | -1.36 | 0.19 | -7.05 | 0.00 |
| Qtibf:Ifam | 1.13 | 0.12 | 0.21 | 0.60 | 0.55 |
| Qcolost:Ifam | 0.28 | -1.27 | 0.18 | -6.88 | 0.00 |
| Qcerealav:Ifam | 0.37 | -0.98 | 0.16 | -6.00 | 0.00 |
| Qwork:Ianm | 0.17 | -1.78 | 0.46 | -3.88 | 0.00 |
| Qcordst:Ianm | 0.44 | -0.81 | 0.25 | -3.20 | 0.00 |
| Qhidep:Ianm | 0.05 | -2.94 | 0.51 | -5.72 | 0.00 |
| Qifa:Ianm | 1.26 | 0.23 | 0.28 | 0.81 | 0.42 |
| Qtibf:Ianm | 3.22 | 1.17 | 0.31 | 3.72 | 0.00 |
| Qancreg:Ianm | 0.25 | -1.37 | 0.28 | -4.87 | 0.00 |
| Qcerealav:Ianm | 0.20 | -1.61 | 0.34 | -4.68 | 0.00 |
| Qfast:Iasha | 0.81 | -0.21 | 0.52 | -0.40 | 0.69 |
| Qwork:Iasha | 0.46 | -0.79 | 0.30 | -2.59 | 0.01 |
| Qcordst:Iasha | 0.27 | -1.32 | 0.20 | -6.64 | 0.00 |
| Qhidep:Iasha | 0.20 | -1.59 | 0.24 | -6.56 | 0.00 |
| Qifa:Iasha | 1.71 | 0.54 | 0.23 | 2.34 | 0.02 |
| Qtibf:Iasha | 2.62 | 0.96 | 0.29 | 3.37 | 0.00 |
| Qcolost:Iasha | 0.85 | -0.16 | 0.29 | -0.57 | 0.57 |
| Qancreg:Iasha | 0.94 | -0.06 | 0.18 | -0.34 | 0.73 |
| Qcerealav:Iasha | 0.36 | -1.03 | 0.29 | -3.52 | 0.00 |
| Qcordst:Idai | 0.34 | -1.07 | 0.34 | -3.17 | 0.00 |
| Qtibf:Idai | 8.66 | 2.16 | 0.37 | 5.81 | 0.00 |
| Qcolost:Idai | 1.61 | 0.48 | 0.33 | 1.44 | 0.15 |
| Qcerealav:Idai | 0.26 | -1.33 | 0.27 | -4.86 | 0.00 |
| Qfast:Ifriendrelnei | 0.22 | -1.53 | 0.18 | -8.58 | 0.00 |
| Qwork:Ifriendrelnei | 0.75 | -0.29 | 0.19 | -1.52 | 0.13 |
| Qcordst:Ifriendrelnei | 0.19 | -1.67 | 0.26 | -6.49 | 0.00 |
| Qhidep:Ifriendrelnei | 0.58 | -0.55 | 0.24 | -2.25 | 0.02 |
| Qcolost:Ifriendrelnei | 0.60 | -0.51 | 0.23 | -2.17 | 0.03 |
| Qancreg:Ifriendrelnei | 1.31 | 0.27 | 0.21 | 1.26 | 0.21 |
| Qcerealav:Ifriendrelnei | 0.68 | -0.38 | 0.18 | -2.10 | 0.04 |
| Qwork:Iprivclinic | 12.57 | 2.53 | 0.54 | 4.69 | 0.00 |
| Qcordst:Iprivclinic | 0.13 | -2.00 | 0.29 | -6.81 | 0.00 |
| Qifa:Iprivclinic | 11.56 | 2.45 | 0.32 | 7.70 | 0.00 |
| Qtibf:Iprivclinic | 0.39 | -0.93 | 0.40 | -2.33 | 0.02 |
| Qcolost:Iprivclinic | 0.64 | -0.45 | 0.40 | -1.13 | 0.26 |
| Qancreg:Iprivclinic | 0.81 | -0.21 | 0.81 | -0.25 | 0.80 |
| Qcordst:Igovdoc | 0.13 | -2.07 | 0.35 | -5.85 | 0.00 |
| Qcolost:Igovdoc | 0.27 | -1.30 | 0.55 | -2.38 | 0.02 |
| Qcerealav:Igovdoc | 0.09 | -2.42 | 0.46 | -5.28 | 0.00 |
| Qcordst:Irmp | 0.04 | -3.22 | 0.63 | -5.09 | 0.00 |
| Qifa:Imedia | 0.19 | -1.68 | 0.89 | -1.89 | 0.06 |
| Qtibf:IOTHER | 1.45 | 0.37 | 0.66 | 0.56 | 0.58 |
| Qcolost:IOTHER | 1.77 | 0.57 | 0.82 | 0.70 | 0.48 |
| Qancreg:IOTHER | 1.56 | 0.45 | 0.75 | 0.60 | 0.55 |
Here are the variance inflation factors for the big model fit to the Mother data:
| GVIF | Df | GVIF^(1/(2*Df)) | |
|---|---|---|---|
| Qcerealav | 4.7 | 1 | 2.17 |
| Ianm | 4.9 | 1 | 2.21 |
Here is the ‘big model’ for the ASHA data:
| expEst | Estimate | Std. Error | z value | Pr(>|z|) | |
|---|---|---|---|---|---|
| (Intercept) | 0.40 | -0.92 | 0.29 | -3.24 | 0.00 |
| ageclass30-34 | 0.83 | -0.18 | 0.17 | -1.08 | 0.28 |
| ageclass35-39 | 0.74 | -0.31 | 0.16 | -1.88 | 0.06 |
| ageclass40-44 | 0.61 | -0.50 | 0.17 | -2.96 | 0.00 |
| ageclass45-49 | 0.54 | -0.62 | 0.18 | -3.40 | 0.00 |
| ageclass50-65 | 0.55 | -0.59 | 0.21 | -2.83 | 0.00 |
| nkidscat2 | 1.07 | 0.07 | 0.20 | 0.35 | 0.73 |
| nkidscat3 | 1.02 | 0.02 | 0.19 | 0.10 | 0.92 |
| nkidscat4 | 0.93 | -0.07 | 0.20 | -0.38 | 0.71 |
| nkidscat5+ | 0.86 | -0.15 | 0.21 | -0.73 | 0.46 |
| educat9to10 | 1.04 | 0.04 | 0.11 | 0.40 | 0.69 |
| educat11to13 | 1.21 | 0.19 | 0.12 | 1.54 | 0.12 |
| educat14to17 | 1.39 | 0.33 | 0.17 | 1.93 | 0.05 |
| wealthq2 | 0.75 | -0.29 | 0.13 | -2.22 | 0.03 |
| wealthq3 | 0.87 | -0.14 | 0.13 | -1.04 | 0.30 |
| wealthq4 | 0.84 | -0.17 | 0.13 | -1.32 | 0.19 |
| wealthq5 | 0.79 | -0.24 | 0.13 | -1.77 | 0.08 |
| Qanccheck | 0.40 | -0.92 | 0.27 | -3.48 | 0.00 |
| Qancreg | 0.27 | -1.32 | 0.27 | -4.89 | 0.00 |
| Qbath | 9.67 | 2.27 | 0.32 | 7.02 | 0.00 |
| Qcerealav | 9.97 | 2.30 | 0.33 | 6.92 | 0.00 |
| Qcolost | 26.44 | 3.27 | 0.37 | 8.87 | 0.00 |
| Qcordst | 3.06 | 1.12 | 0.32 | 3.51 | 0.00 |
| Qfast | 0.94 | -0.07 | 0.23 | -0.29 | 0.77 |
| Qhidep | 0.49 | -0.71 | 0.21 | -3.32 | 0.00 |
| Qifa | 0.17 | -1.79 | 0.35 | -5.04 | 0.00 |
| Qtibf | 1.99 | 0.69 | 0.20 | 3.43 | 0.00 |
| Qwork | 1.43 | 0.36 | 0.28 | 1.29 | 0.20 |
| Ifam | 1.18 | 0.17 | 0.14 | 1.15 | 0.25 |
| Ianm | 12.22 | 2.50 | 0.21 | 11.93 | 0.00 |
| Iasha | 5.81 | 1.76 | 0.29 | 6.16 | 0.00 |
| Idai | 0.25 | -1.40 | 0.17 | -8.12 | 0.00 |
| Ifriendrelnei | 1.13 | 0.12 | 0.14 | 0.87 | 0.39 |
| Iprivclinic | 56.71 | 4.04 | 0.40 | 10.07 | 0.00 |
| Igovdoc | 6.64 | 1.89 | 0.40 | 4.75 | 0.00 |
| Irmp | 7.23 | 1.98 | 0.42 | 4.73 | 0.00 |
| Imedia | 17.23 | 2.85 | 0.60 | 4.77 | 0.00 |
| Itraining | 144.52 | 4.97 | 0.74 | 6.76 | 0.00 |
| IOTHER | 5.17 | 1.64 | 0.32 | 5.21 | 0.00 |
| Qwork:Ifam | 3.58 | 1.27 | 0.30 | 4.23 | 0.00 |
| Qcordst:Ifam | 0.36 | -1.02 | 0.34 | -2.96 | 0.00 |
| Qbath:Ifam | 0.41 | -0.88 | 0.32 | -2.78 | 0.01 |
| Qifa:Ifam | 5.92 | 1.78 | 0.50 | 3.55 | 0.00 |
| Qcolost:Ifam | 0.32 | -1.14 | 0.37 | -3.10 | 0.00 |
| Qancreg:Ifam | 2.17 | 0.77 | 0.36 | 2.15 | 0.03 |
| Qanccheck:Ifam | 2.96 | 1.09 | 0.32 | 3.36 | 0.00 |
| Qcerealav:Ifam | 0.53 | -0.63 | 0.34 | -1.84 | 0.07 |
| Qcordst:Ianm | 0.12 | -2.09 | 0.42 | -5.03 | 0.00 |
| Qbath:Ianm | 0.14 | -1.94 | 0.54 | -3.57 | 0.00 |
| Qhidep:Ianm | 0.03 | -3.55 | 0.76 | -4.64 | 0.00 |
| Qifa:Ianm | 6.66 | 1.90 | 0.52 | 3.64 | 0.00 |
| Qcerealav:Ianm | 0.17 | -1.77 | 0.55 | -3.23 | 0.00 |
| Qwork:Iasha | 0.12 | -2.10 | 0.96 | -2.18 | 0.03 |
| Qtibf:Idai | 9.23 | 2.22 | 0.35 | 6.38 | 0.00 |
| Qfast:Ifriendrelnei | 0.33 | -1.11 | 0.35 | -3.20 | 0.00 |
| Qwork:Ifriendrelnei | 2.40 | 0.88 | 0.31 | 2.81 | 0.00 |
| Qcordst:Ifriendrelnei | 0.32 | -1.13 | 0.41 | -2.78 | 0.01 |
| Qbath:Ifriendrelnei | 0.58 | -0.55 | 0.29 | -1.89 | 0.06 |
| Qifa:Ifriendrelnei | 12.90 | 2.56 | 0.83 | 3.09 | 0.00 |
| Qcolost:Ifriendrelnei | 0.38 | -0.97 | 0.34 | -2.87 | 0.00 |
| Qancreg:Ifriendrelnei | 3.01 | 1.10 | 0.40 | 2.74 | 0.01 |
| Qanccheck:Ifriendrelnei | 4.29 | 1.46 | 0.40 | 3.64 | 0.00 |
| Qcordst:Iprivclinic | 0.01 | -4.49 | 0.55 | -8.16 | 0.00 |
| Qbath:Iprivclinic | 0.05 | -2.94 | 0.72 | -4.10 | 0.00 |
| Qtibf:Iprivclinic | 0.12 | -2.12 | 0.66 | -3.18 | 0.00 |
| Qcolost:Iprivclinic | 0.08 | -2.56 | 0.87 | -2.96 | 0.00 |
| Qancreg:Iprivclinic | 0.02 | -3.98 | 1.98 | -2.01 | 0.04 |
| Qanccheck:Iprivclinic | 0.17 | -1.79 | 0.62 | -2.89 | 0.00 |
| Qcerealav:Iprivclinic | 0.00 | -5.34 | 0.59 | -9.02 | 0.00 |
| Qcordst:Igovdoc | 0.25 | -1.40 | 0.68 | -2.07 | 0.04 |
| Qifa:Igovdoc | 5.53 | 1.71 | 1.00 | 1.71 | 0.09 |
| Qcordst:Irmp | 0.03 | -3.57 | 0.61 | -5.80 | 0.00 |
| Qifa:Irmp | 3.57 | 1.27 | 0.81 | 1.57 | 0.12 |
| Qanccheck:Irmp | 0.05 | -3.10 | 1.02 | -3.02 | 0.00 |
| Qanccheck:Imedia | 0.10 | -2.29 | 1.30 | -1.76 | 0.08 |
| Qcordst:Itraining | 0.08 | -2.47 | 0.98 | -2.52 | 0.01 |
| Qhidep:Itraining | 0.01 | -4.29 | 1.10 | -3.91 | 0.00 |
| Qifa:Itraining | 0.15 | -1.89 | 1.20 | -1.58 | 0.11 |
| Qfast:IOTHER | 0.02 | -3.92 | 1.40 | -2.81 | 0.00 |
Here are the variance inflation factors for the big model fit to the ASHA data:
| GVIF | Df | GVIF^(1/(2*Df)) | |
|---|---|---|---|
| Qbath | 6.27 | 1 | 2.50 |
| Qcerealav | 7.58 | 1 | 2.75 |
| Qcolost | 5.63 | 1 | 2.37 |
| Qcordst | 4.90 | 1 | 2.21 |
| Qwork | 4.21 | 1 | 2.05 |
| Iprivclinic | 6.12 | 1 | 2.47 |
| Itraining | 4.19 | 1 | 2.05 |
| Qbath:Ifam | 4.54 | 1 | 2.13 |
| Qcolost:Ifam | 4.16 | 1 | 2.04 |
| Qcerealav:Ifam | 6.49 | 1 | 2.55 |
Here is a visual depiction of the odds ratios for each model. Note, odds ratios below one mean that the variable had a negative effect alignment with biomedical recommendations and odds ratios above 1.0 mean a positive effect. In both cases these positive and negative effects are relative to the reference categories for each variable. Note also, as a friendly reminder: since these models contain interactions, the odds ratios associated with the main effect cannot be readily interpreted without including the effects of the interaction.
To understand the above results, especially how interactions affects our understanding of the effects of each influencer, lets go over an example. The log odds (Estimate, the second column of each of the above tables) for the Dai is -0.146 for Mothers and -1.4 for ASHAs, which cannot be taken to imply an overall negative influence of the Dai on women engaging in biomedically recommended behaviors because the model contains interactions and we have to account for the intercept.
For instance, to quantify the effect of the Dai on ANC registration we add the model intercept (log odds) (-0.84) plus the estimate for the question (-0.629) plus the estimate for the Dai (-0.146), which gives: -1.615.
If we do the same for the ASHA data we get: -0.92 plus -1.32 plus -1.4, which equals: -3.64, implying that the Dai lowered the odds of ANC registration much more for the ASHAs than they do for the more recent births in the Mother data.
For behaviors that have interactions we have to take those into account as well when isolating each influencer on each question. In the Mother data there is a significant interaction between ASHA and hiding the pregnancy. To calculate the overall effect of the ASHA we would add the intercept (-0.84) plus the estimate for the question (-1.056) plus the estimate for the ASHA (2.319) plus their interaction (-1.593), which gives-1.17.
Using the same model we calculate results on a different scale, probability, which is more intuitive and more readily incorporates the effects of interactions in the model (see below).