13.3 Relative conditional indirect effects
Before we use Hayes’s formulas at the top of pate 488 to re-express the posterior in terms of the relative conditional indirect effects, we might want to clarify which of the post columns correspond to the relevant parameters.
- \(a_{1}\) =
b_respappr_D1 - \(a_{2}\) =
b_respappr_D2 - \(a_{4}\) =
b_respappr_D1:sexism - \(a_{5}\) =
b_respappr_D2:sexism - \(b\) =
b_liking_respappr
To get our posterior transformations, we’ll use the purrr::map() approach, which first requires we define two custom functions.
# (a1 + a4W)*b
D1_function <- function(w){
  (post$b_respappr_D1 + post$`b_respappr_D1:sexism`*w)*post$b_liking_respappr
  }

# (a2 + a5W)*b
D2_function <- function(w){
  (post$b_respappr_D2 + post$`b_respappr_D2:sexism`*w)*post$b_liking_respappr
  }
Next, we’ll make a 30-row tibble with each row containing a value for sexism, ranging from 3.5 to 6.5. We’ll then apply our two custom functions to the sexism values and wrangle the results a bit to make them useful for our purposes.
rcie_tibble <-
  tibble(sexism = seq(from = 3.5, to = 6.5, length.out = 30)) %>%
  group_by(sexism) %>%
  mutate(`Protest vs. No Protest`            = map(sexism, D1_function),
         `Collective vs. Individual Protest` = map(sexism, D2_function)) %>%
  unnest() %>%
  ungroup() %>%
  mutate(iter = rep(1:4000, times = 30)) %>%
  gather(`indirect effect`, value, -sexism, -iter) %>%
  mutate(`indirect effect` = factor(`indirect effect`, levels = c("Protest vs. No Protest", "Collective vs. Individual Protest")))

head(rcie_tibble)
## # A tibble: 6 x 4
## sexism iter `indirect effect` value
## <dbl> <int> <fct> <dbl>
## 1 3.5 1 Protest vs. No Protest 0.160
## 2 3.5 2 Protest vs. No Protest -0.0305
## 3 3.5 3 Protest vs. No Protest -0.174
## 4 3.5 4 Protest vs. No Protest -0.143
## 5 3.5 5 Protest vs. No Protest -0.118
## 6 3.5 6 Protest vs. No Protest 0.00955Here is our variant of Figure 13.4, with respect to the relative conditional indirect effects.
rcie_tibble %>%
  group_by(`indirect effect`, sexism) %>%
  summarize(median = median(value),
            ll = quantile(value, probs = .025),
            ul = quantile(value, probs = .975)) %>%

  ggplot(aes(x = sexism, group = `indirect effect`)) +
  geom_ribbon(aes(ymin = ll, ymax = ul),
              color = "white", fill = "transparent", linetype = 3) +
  geom_line(aes(y = median),
            color = "white") +
  coord_cartesian(xlim = 4:6,
                  ylim = c(-.6, .8)) +
  labs(x = expression(paste("Perceived Pervasiveness of Sex Discrimination in Society (", italic(W), ")")),
       y = "Relative Conditional Effect on Liking") +
  theme_black() +
  theme(panel.grid = element_blank(),
        legend.position = "none") +
  facet_grid(~ `indirect effect`)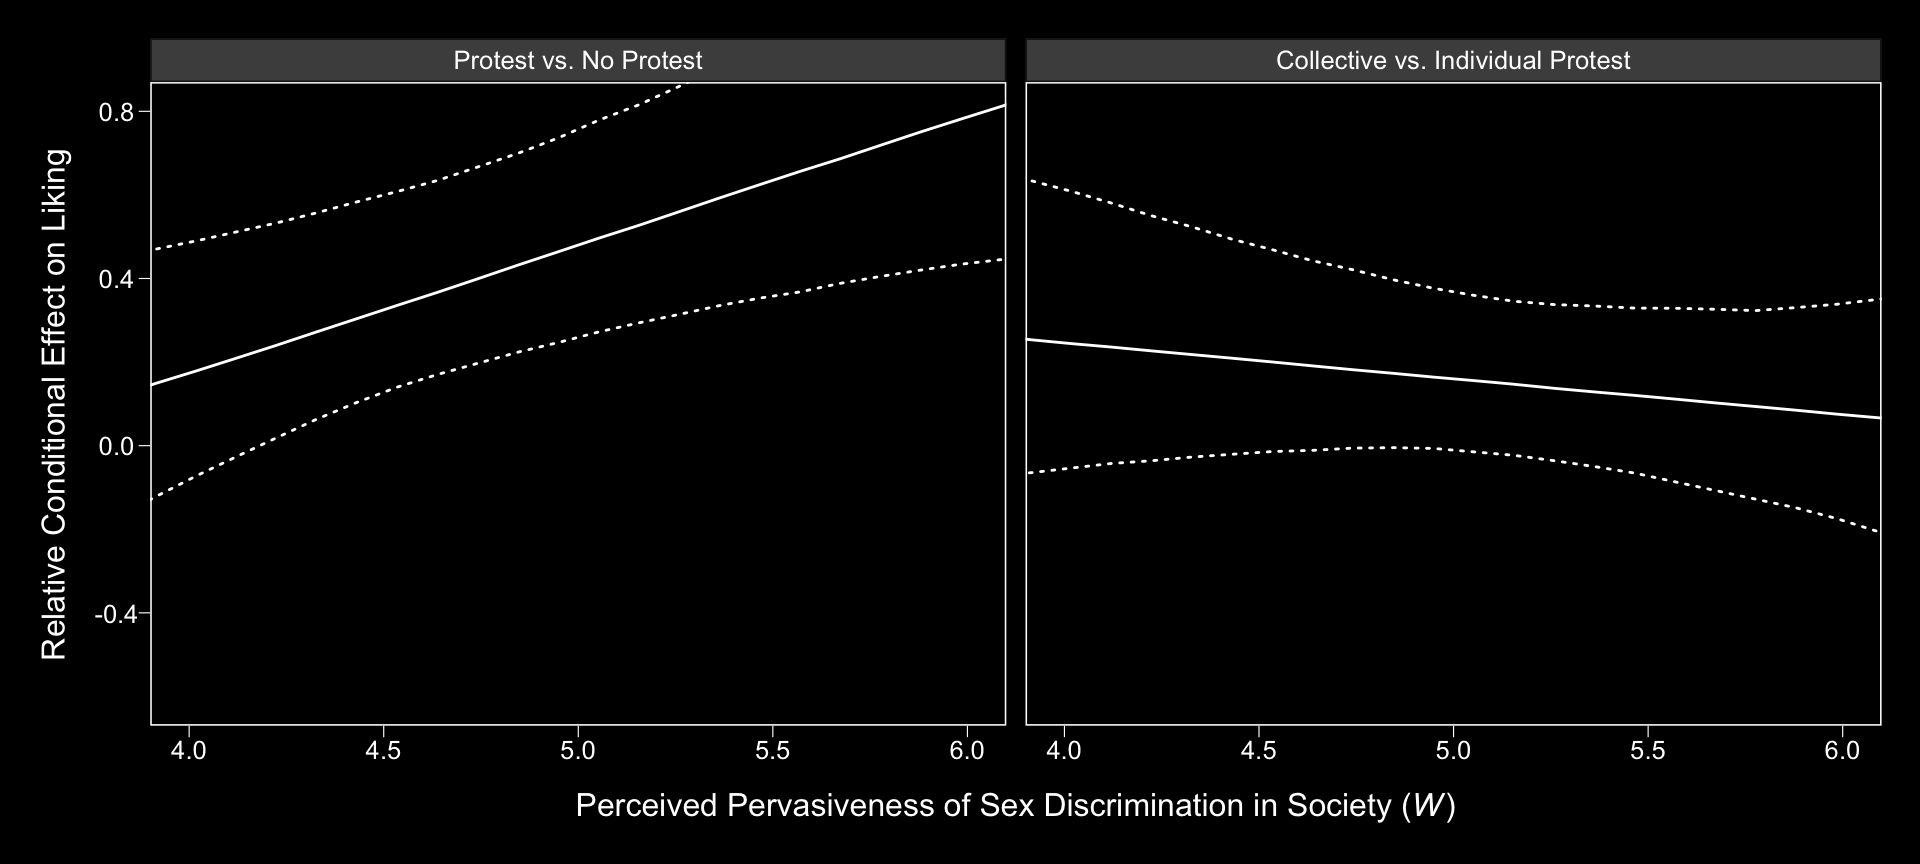
Here are the indirect effect summaries relevant to the contents of Table 13.2.
rcie_tibble_pick_a_point <-
  # notice how we've restricted ourselves to only 3 values for `sexism`
  tibble(sexism = c(4.25, 5.125, 5.896)) %>%
  group_by(sexism) %>%
  mutate(`Protest vs. No Protest` = map(sexism, D1_function),
         `Collective vs. Individual Protest` = map(sexism, D2_function)) %>%
  unnest() %>%
  ungroup() %>%
  # because we only have 3 `sexism` values, we only need to repeat `times = 3`
  mutate(iter = rep(1:4000, times = 3)) %>%
  gather(`indirect effect`, value, -sexism, -iter) %>%
  mutate(`indirect effect` = factor(`indirect effect`, levels = c("Protest vs. No Protest", "Collective vs. Individual Protest")))

rcie_tibble_pick_a_point %>%
  group_by(sexism, `indirect effect`) %>%
  summarize(median = median(value),
            ll = quantile(value, probs = .025),
            ul = quantile(value, probs = .975)) %>%
  mutate_if(is.double, round, digits = 3)
## # A tibble: 6 x 5
## # Groups: sexism [3]
## sexism `indirect effect` median ll ul
## <dbl> <fct> <dbl> <dbl> <dbl>
## 1 4.25 Protest vs. No Protest 0.248 0.03 0.538
## 2 4.25 Collective vs. Individual Protest 0.225 -0.033 0.545
## 3 5.12 Protest vs. No Protest 0.518 0.288 0.807
## 4 5.12 Collective vs. Individual Protest 0.15 -0.021 0.347
## 5 5.90 Protest vs. No Protest 0.755 0.423 1.16
## 6 5.90 Collective vs. Individual Protest 0.083 -0.152 0.331