7.3 Survival function
The distribution of any random variable \(X\) can be described using its cumulative distribution function (CDF) \(F(x) = P(X \leq x)\). This represents the probability that \(X\) takes on a value up to and including \(x\). For a random event time \(T\), the CDF is \(F(t) = P(T \leq t)\), the probability that the event occurs prior to or at time \(t\), but not later than \(t\). In survival analysis, however, we typically work with the survival function \(S(t)\) which is the probability that an individual has survived past \(t\) (not yet experienced the event as of time \(t\)). This is the complement of the CDF – instead of the cumulative probability up to and including \(t\), it is the cumulative probability after \(t\). So \(S(t) = 1 - F(t) = P(T > t)\).
Example 7.1 (continued): The estimated survival function for the outcome preterm birth in the Natality teaching dataset is shown in Figure 7.2. The “event” is preterm birth, so “survival” past time \(t\) here means not yet having given birth as of time \(t\).
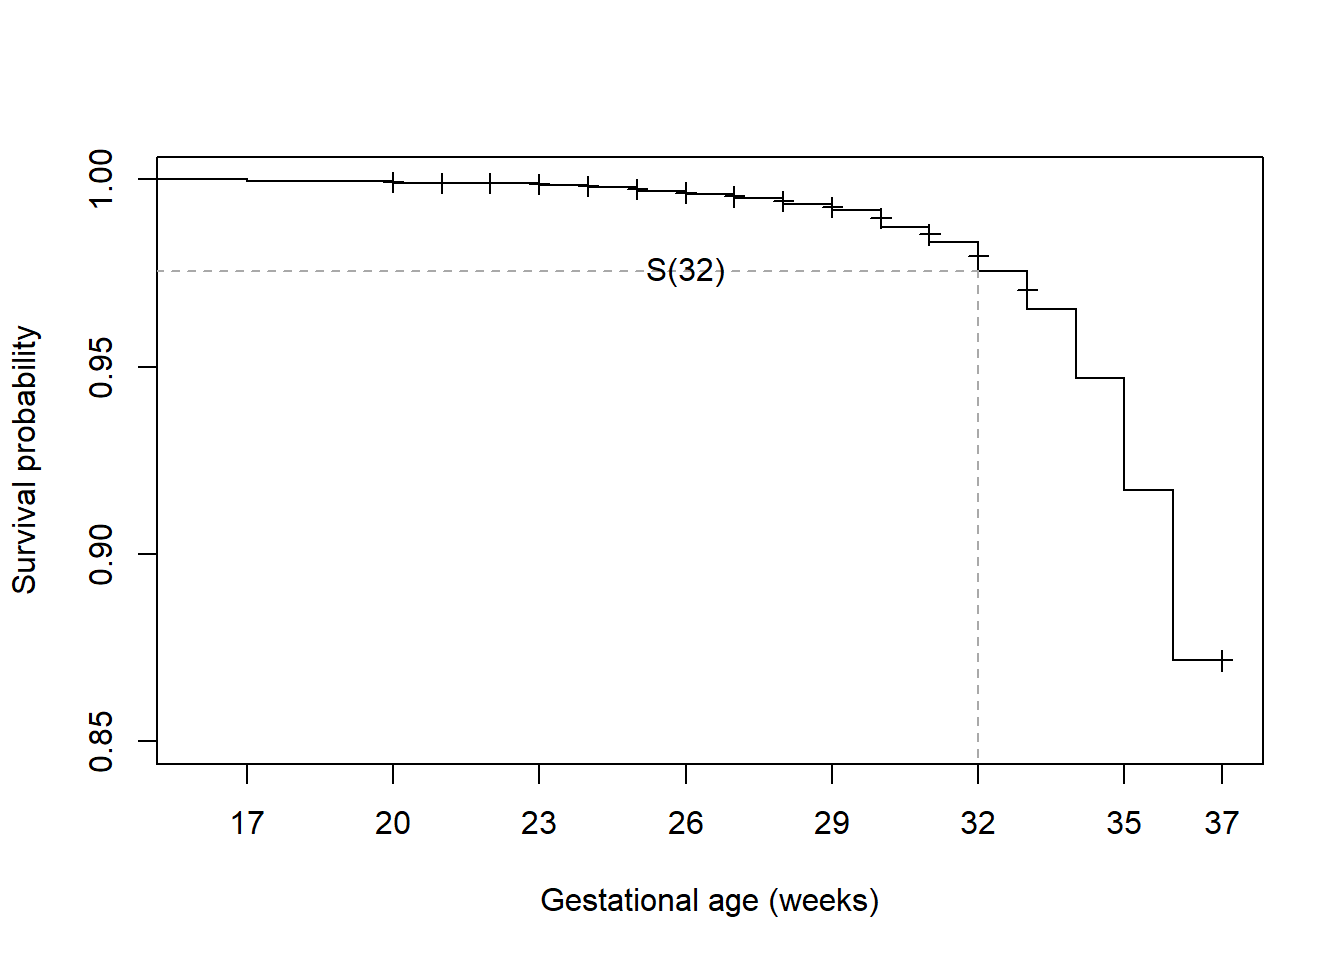
Figure 7.2: Survival function for time to preterm birth
For example, the function value at \(t = 32\) weeks, \(S(32)\), is 0.976, indicating that the probability of “survival” (not yet having a preterm birth) past 32 weeks is 97.6%. Equivalently, only 2.4% of pregnancies resulted in a preterm birth prior to or at 32 weeks. The estimated survival function has a stair-step pattern. When reading a survival function at an event time where the function is drawn as a vertical line, the value of \(S(t)\) is at the bottom of the step.
Out of \(n = 2000\) pregnant women in this dataset, none experienced a preterm birth prior to gestational age 17 weeks, so \(S(t) = 1\) for all times up to 17 weeks, at which time there was one preterm birth. The function starts at 1 (100% no event) and drops by \(1/n\) at 17 weeks to \(1999 / 2000\), the proportion of individuals under observation who had not experienced a preterm birth as of that time.
The survival function drops at each time when an event occurred. Plus signs in the plot indicate censored times. The survival function does not drop at censored times (unless there is an observed event at that time, as well), but censored times do influence the size of the drop at the next observed event time since they are no longer in the denominator (the “risk set”, discussed in Section 7.6). As time increases, moving left to right, the survival probability either stays the same or drops. At the end of the observation time, in this case at week 37 when the risk of preterm birth ends by definition, the remaining individuals have censored times and the estimated survival function beyond that day is not defined.
We will discuss in more detail how the survival function is estimated when we discuss the Kaplan-Meier method in Section 7.6.