6.20 Conditional logistic regression for matched case-control data
Some case-control studies employ matching in an attempt to ensure the controls are comparable to the cases on confounding variables. Matching, however, must be taken into account in the analysis method. Matched case-control data can be validly analyzed using conditional logistic regression which stratifies the analysis by groups defined by the unique combinations of the matching variables. To carry out a conditional logistic regression in R, use the clogit() function (Gail, Lubin, and Rubinstein 1981; Logan 1983) in the survival library (T. M. Therneau 2024) with the matching variables listed as strata in the model. clogit() expects the outcome to be numeric with possible values 0 and 1, and the output does not contain an intercept. The conditional logit model does not estimate associations between the strata variables and the outcome. However, since their purpose was to control for confounding, this is not typically an issue.
Example 6.6: A matched case-control dataset of births was created from a subset of the 2018 U.S. Natality teaching dataset, containing 195 births that were followed by admission to the newborn intensive care unit (AB_NICU) and 1375 births that were not, matched on maternal education (MEDUC) and age (MAGER). Assess the association between admission to the newborn intensive care unit and previous preterm birth (RF_PPTERM), accounting for the matching in the analysis.
After loading the data, check the formatting of the outcome and convert to 0/1, if needed.
##
##   No  Yes
## 1375  195
# clogit() expects a 0/1 outcome
# Convert from No/Yes to 0/1
natality_CC <- natality_CC %>%
mutate(NICU = as.numeric(AB_NICU == "Yes"))
# Check derivation
table(natality_CC$AB_NICU, natality_CC$NICU, useNA = "ifany")##
## 0 1
## No 1375 0
## Yes 0 195Next, verify that the distributions of the matching variables are the same for cases and controls.
##
##                      0       1
##   <HS          0.10036 0.12308
##   HS           0.28945 0.33333
##   Some college 0.27709 0.26154
##   Bachelor     0.23636 0.17436
##   Adv Degree   0.09673 0.10769
##   Sum          1.00000 1.00000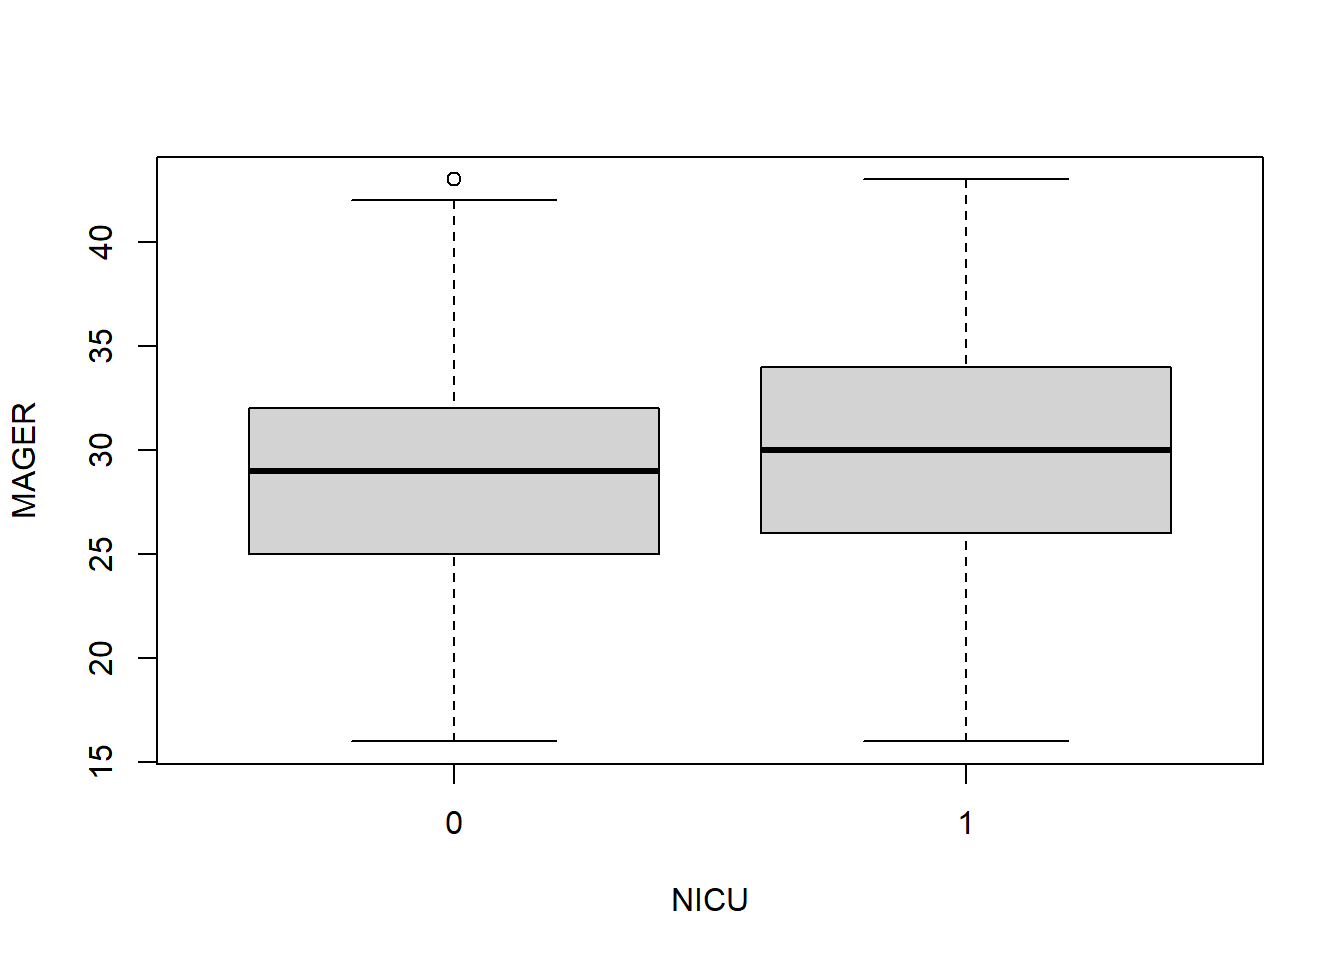
Matching is not always perfect. The distributions are not identical between cases and controls but are pretty close.
Finally, fit the conditional logit model and examine the output.
library(survival)
fit.clr <- clogit(NICU ~ RF_PPTERM + strata(MEDUC, MAGER),
                  data = natality_CC)

# Regression coefficient
round(summary(fit.clr)$coef, 4)
## coef exp(coef) se(coef) z Pr(>|z|)
## RF_PPTERMYes 1.123 3.074 0.316 3.554 0.0004## OR 2.5 % 97.5 %
## RF_PPTERMYes 3.074 1.655 5.71## Analysis of Deviance Table (Type III tests)
##
## Response: Surv(rep(1, 1570L), NICU)
## Df Chisq Pr(>Chisq)
## RF_PPTERM 1 12.6 0.00038 ***
## ---
## Signif. codes: 0 '***' 0.001 '**' 0.01 '*' 0.05 '.' 0.1 ' ' 1Conclusion: Previous preterm birth is significantly associated with admission to the NICU (p <.001). Infants born to mothers with a previous preterm birth have 3.1 times the odds of admission to the NICU (OR = 3.07; 95% CI = 1.65, 5.71; p <.001).