7.20 Influential observations
Check for influential observations by examining standardized DFBetas (see Section 5.23). Fit the model, plot the DFBetas, and, if there are observations with values that are large, conduct a sensitivity analysis to see if their removal impacts your overall conclusions (see Section 5.26). A cutoff of 0.2 is reasonable (Harrell 2015, 504).
# Compute DFBETAS
DFBETAS <- resid(cox.ex7.6, type = "dfbetas")
# Examine the first few rows
head(DFBETAS)
## [,1] [,2] [,3] [,4] [,5] [,6]
## 1 0.0040352 -0.005820 -0.004481 -0.0001244 -0.017555 0.009765
## 2 0.2085628 -0.012956 -0.104859 -0.0335294 -0.091015 0.084854
## 3 0.0048140 0.013115 -0.018220 0.0001619 0.001473 -0.003342
## 4 0.0023748 0.014455 0.002487 0.0001607 -0.014082 -0.002793
## 5 0.0012622 0.001298 0.003561 0.0030316 0.003920 0.004394
## 6 0.0006693 0.009121 0.003413 -0.0273620 0.002322 -0.006725# Plot
par(mfrow=c(2,3))
plot(DFBETAS[, 1], main="RF_PPTERMYes", ylab="")
abline(h = c(-0.2, 0.2), lty = 2, col = "red")
plot(DFBETAS[, 2], main="MAGER", ylab="")
abline(h = c(-0.2, 0.2), lty = 2, col = "red")
plot(DFBETAS[, 3], main="MRACEHISPNH Black", ylab="")
abline(h = c(-0.2, 0.2), lty = 2, col = "red")
plot(DFBETAS[, 4], main="MRACEHISPNH Other", ylab="")
abline(h = c(-0.2, 0.2), lty = 2, col = "red")
plot(DFBETAS[, 5], main="MRACEHISPHispanic", ylab="")
abline(h = c(-0.2, 0.2), lty = 2, col = "red")
plot(DFBETAS[, 6], main="DMARUnmarried", ylab="")
abline(h = c(-0.2, 0.2), lty = 2, col = "red")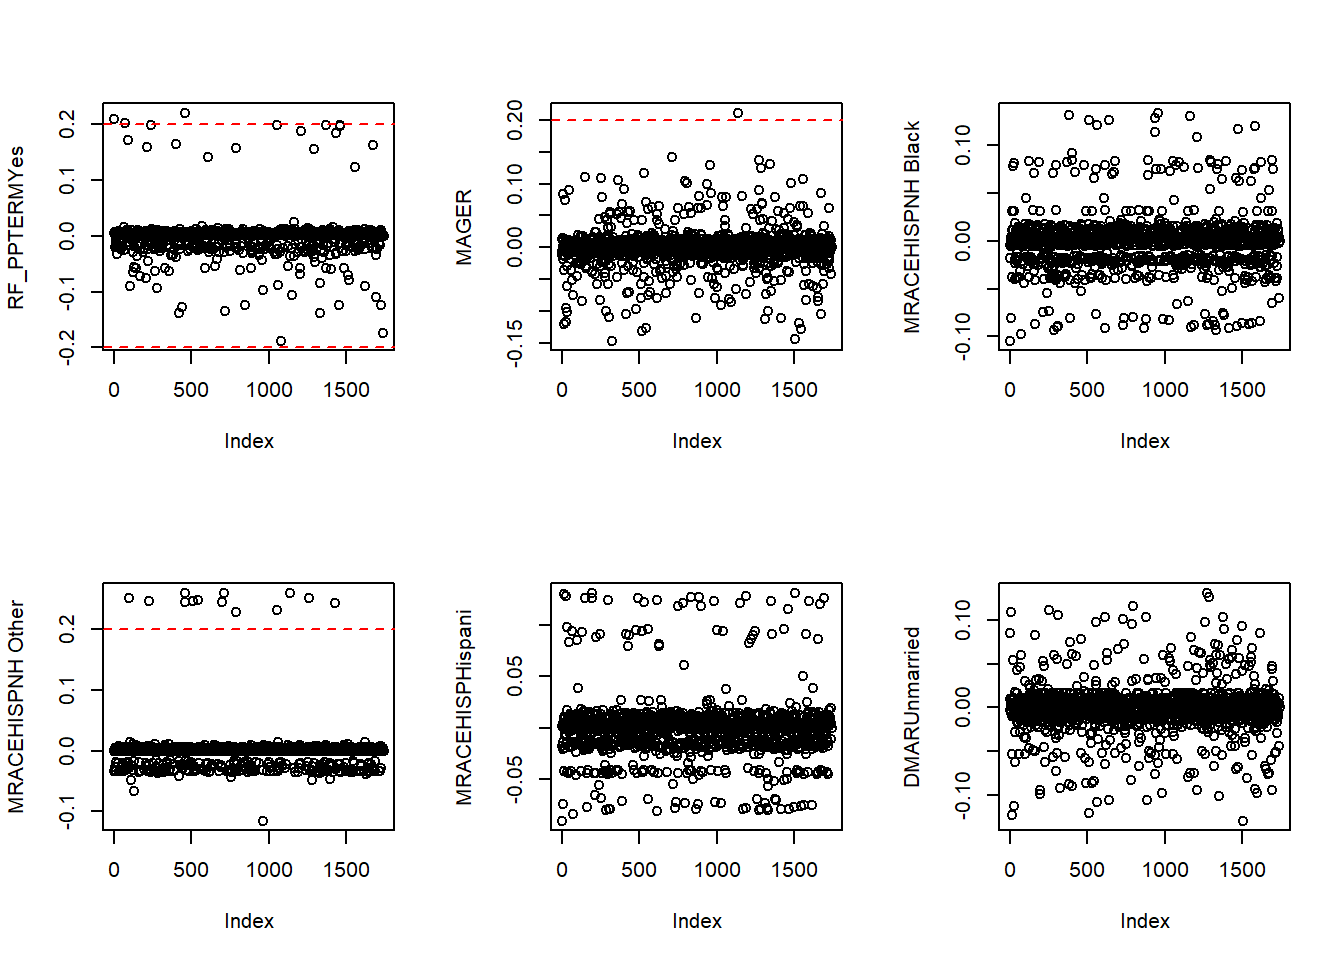
Figure 7.24: DFBetas from a Cox regression
There appear to be a number of influential observations (Figure 7.24). For MRACEHISP = “Other” (lower left panel), there is a group of observations with standardized DFBeta > 0.2. Upon closer examination, we find that these individuals are the entire group of preterm births among non-Hispanic Other mothers. This group is small enough, and the prevalence of preterm birth is small enough, that there are only a few events in this group. Thus, removing any one of them highly impacts the regression coefficient (they each have a large DFBeta value).
# "MRACEHISPNH Other" is the 4th term in the model
SUB <- DFBETAS[, 4] > 0.2

# Race x Preterm among those with large DFBetas
table(natality.complete$MRACEHISP[ SUB],
      natality.complete$preterm01[ SUB])
##
## 1
## NH White 0
## NH Black 0
## NH Other 13
## Hispanic 0# Race x Preterm among those without large DFBetas
table(natality.complete$MRACEHISP[!SUB],
natality.complete$preterm01[!SUB])##
## 0 1
## NH White 865 96
## NH Black 233 58
## NH Other 128 0
## Hispanic 299 51