7.11 Plotting the estimated survival function
By computing predicted survival probabilities over a range of times, we can plot the survival function estimated by Cox regression for any set of predictor values. This is especially useful if we want to visually compare the estimated survival functions between groups.
NOTE: The estimated curves plotted here serve the specific purpose of illustrating relative differences between groups under the assumptions of the model and the form of the predictors included. The estimated absolute survival probabilities depend on the specific predictor values chosen and only represent individuals with those values rather than the average survival of a cohort of individuals with different predictor values. See T. Therneau, Crowson, and Atkinson (2015) for a discussion of options for estimating the adjusted survival function for a reference cohort, rather than for one specific set of predictor values as is done here, and, optionally, with less restrictive model assumptions. Some of these options are implemented in the ggadjustedcurves() function in the survminer package (Kassambara, Kosinski, and Biecek 2024).
Example 7.6 (continued): Plot the estimated survival functions for those with and without a previous preterm birth. Set the other predictors at their mean or reference level.
First, create a data.frame for each level of the variable we are interested in (RF_PRETERM) containing specific values for the other predictors and a range of times (so we can estimate a curve rather than survival at a single time).
# DF for RF_PPTERM = "Yes"
PPTERM_Yes <- data.frame(preterm01 = 1,
                         gestage37 = 17:36,
                         DMAR      = "Married",
                         MRACEHISP = "NH White",
                         MAGER     = mean(natality.complete$MAGER),
                         RF_PPTERM = "Yes")

# For the other level(s) of the variable of interest, copy and change the value
PPTERM_No <- PPTERM_Yes
PPTERM_No$RF_PPTERM <- "No"
Next, compute the estimates at these values.
PRED_PPTERM_Yes <- predict(cox.ex7.6, PPTERM_Yes, type = "survival")
PRED_PPTERM_No  <- predict(cox.ex7.6, PPTERM_No,  type = "survival")
Finally, plot the estimates vs. time (Figure 7.13).
# Create a blank plot with the correct axis labels and limits
plot(0, 0, col = "white",
     xlab = "Gestational Age (weeks)", ylab = "P(Not yet preterm)",
     xlim = c(17, 36),
     ylim = c(0.70, 1), # ylim = c(0, 1) if you need a larger range
     font.axis = 2, font.lab = 2, cex.axis = 1.25, cex.lab = 1.25)
# Add a line for each group
# NOTE: For lines() the arguments are x, y not y ~ x
lines(PPTERM_No$gestage37,  PRED_PPTERM_No,  lwd = 2, lty = 1)
lines(PPTERM_Yes$gestage37, PRED_PPTERM_Yes, lwd = 2, lty = 2)
legend(17, 0.85, c("No", "Yes"), title = "Previous preterm birth",
       cex=1.2, lty=c(1,2), lwd=c(2,2))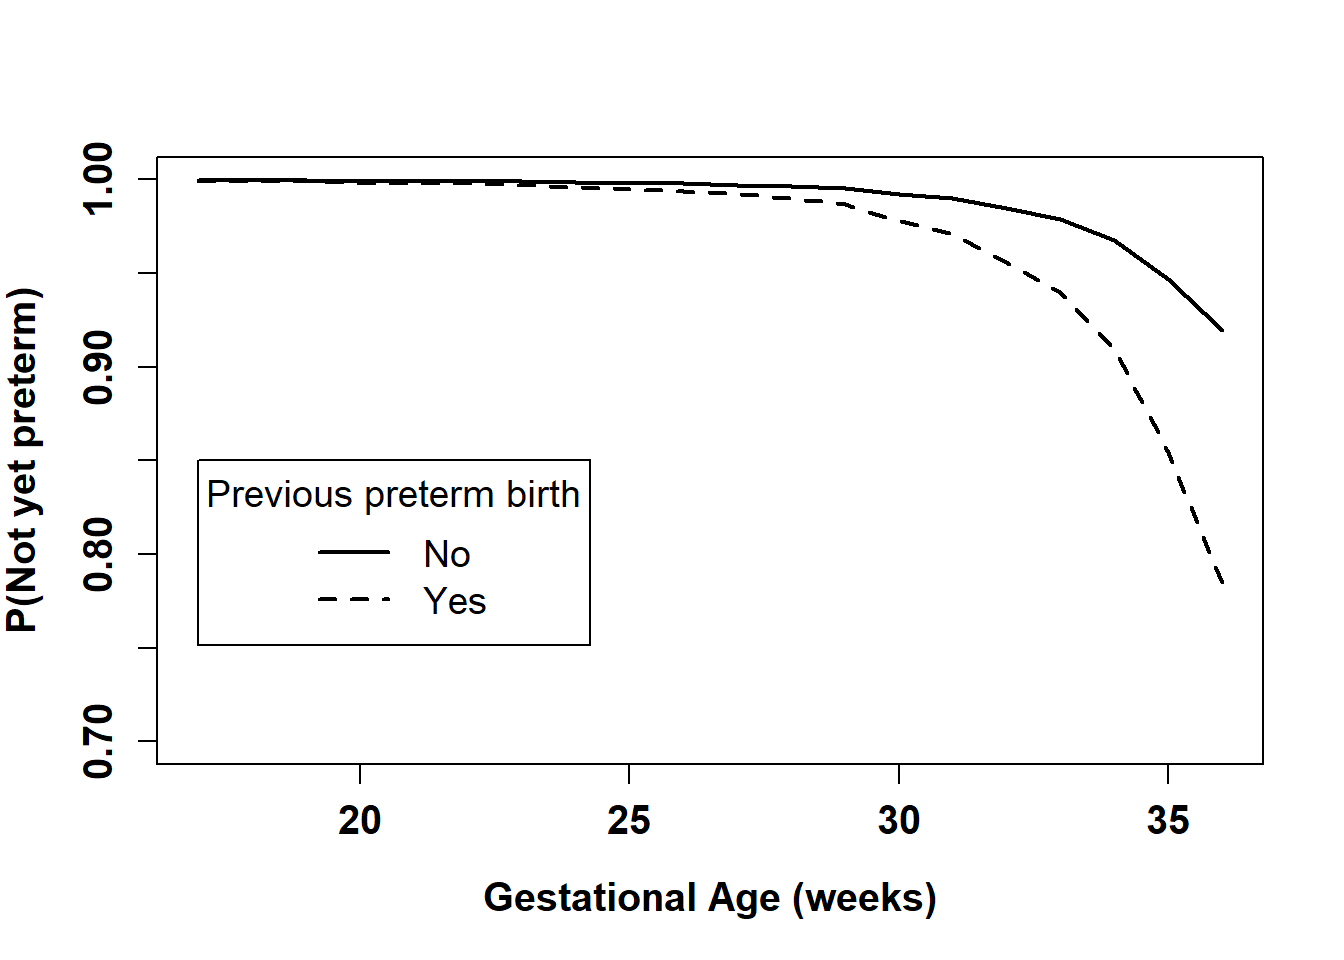
Figure 7.13: Estimated survival function by previous preterm birth
If you plot \(1 - S(t)\) instead, the vertical axis will display the probability of preterm birth (Figure 7.14).
plot(0, 0, col = "white",
     xlab = "Gestational Age (weeks)", ylab = "P(Preterm by this time)",
     xlim = c(17, 36),
     ylim = c(0, 0.3), # ylim = c(0, 1) if you need a larger range
     font.axis = 2, font.lab = 2, cex.axis = 1.25, cex.lab = 1.25)
# Since this is 1 - S(t), reverse the order of the lines
# NOTE: For lines() the arguments are x, y not y ~ x
lines(PPTERM_Yes$gestage37, 1 - PRED_PPTERM_Yes, lwd = 2, lty = 2)
lines(PPTERM_No$gestage37,  1 - PRED_PPTERM_No,  lwd = 2, lty = 1)
legend(17, 0.2, c("Yes", "No"), title = "Previous preterm birth",
       cex=1.2, lty=c(2,1), lwd=c(2,2))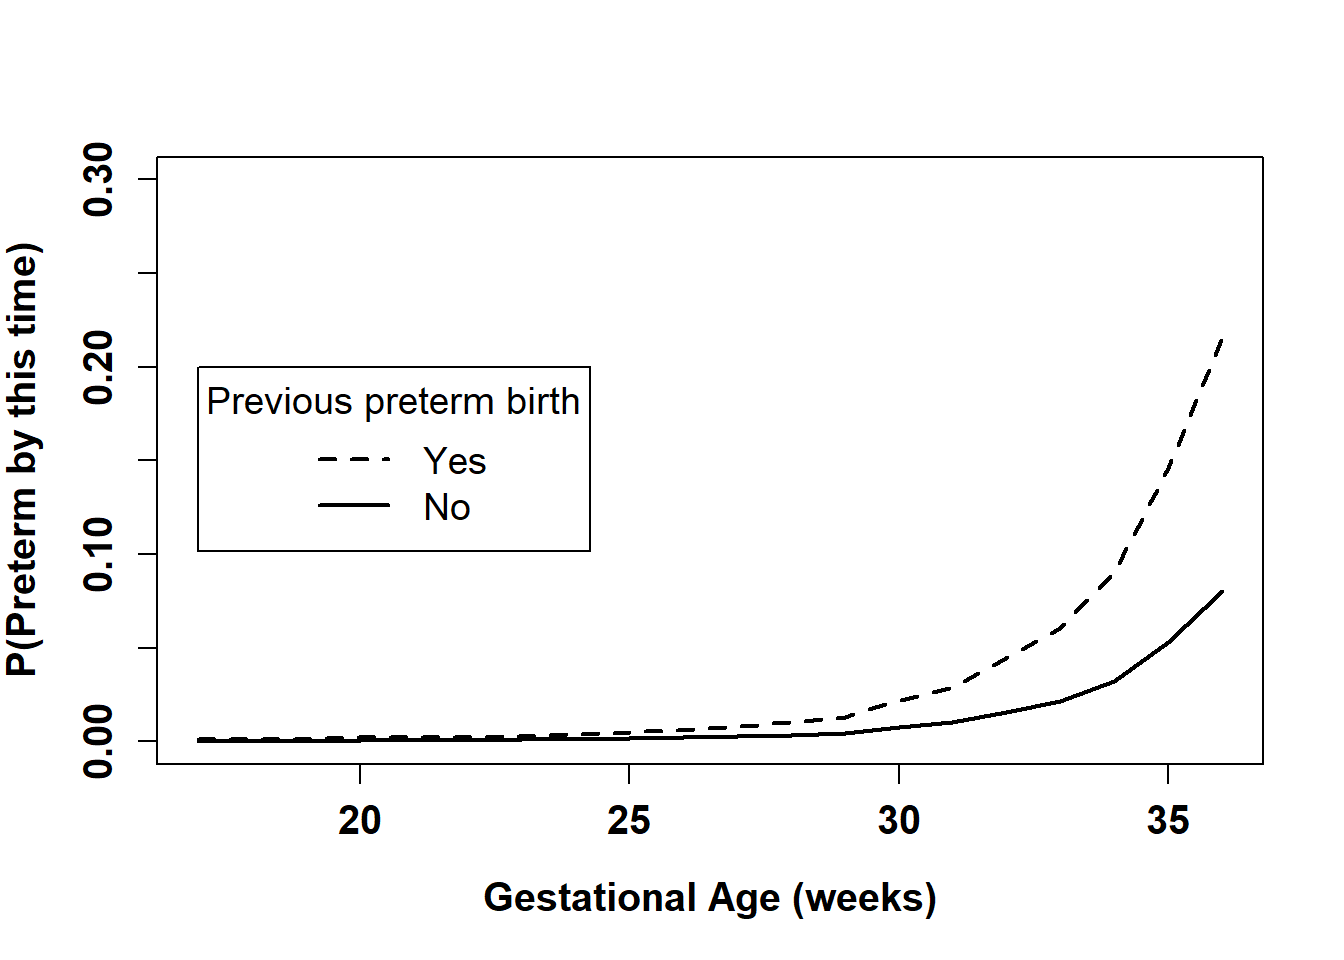
Figure 7.14: Estimated 1 – survival function by previous preterm birth