16.1 Why would you want to write your own function?
Throughout this book, you have been using tons of functions either built into base-R – like mean(), hist(), t.test(), or written by other people and saved in packages – like pirateplot() and apa() in the yarrr package. However, because R is a complete programming language, you can easily write your own functions that perform specific tasks you want.
For example, let’s say you think the standard histograms made with hist() are pretty boring. Instead, you’d like to you’d like use a fancier version with a more modern design that also displays statistical information. Now of course you know from an earlier chapter that you can customize plots in R any way that you’d like by adding customer parameter values like col, bg (etc.). However, it would be a pain to have to specify all of these custom parameters every time you want to create your custom histogram. To accomplish this, you can write your own custom function called piratehist() that automatically includes your custom specifications.
In the following code, I will define a new function called piratehist(). Just like the standard hist() function,piratehist() will take a vector of data (plus optional arguments indicated by ...), create a light gray histogram, and adds text to the top of the figure indicating the mean and 95% CI of the data.
# Create a function called piratehist
piratehist <- function(x, ...) {

# Create a customized histogram
hist(x,
     col = gray(.5, .2),
     border = "white",
     yaxt = "n",
     ylab = "",
     ...)

# Calculate the conf interval
ci <- t.test(x)$conf.int

# Define and add top-text
top.text <- paste(
  "Mean = ", round(mean(x), 2),
  " (95% CI [", round(ci[1], 2),
  ", ", round(ci[2], 2),
  "]), SD = ", round(sd(x), 2),
  sep = "")

mtext(top.text, side = 3)
}
Now that I’ve defined the piratehist() function, let’s evaluate it on a vector of data!
# Create a pirate histogram!
piratehist(pirates$age,
        xlab = "Age",
        main = "Pirates' Ages")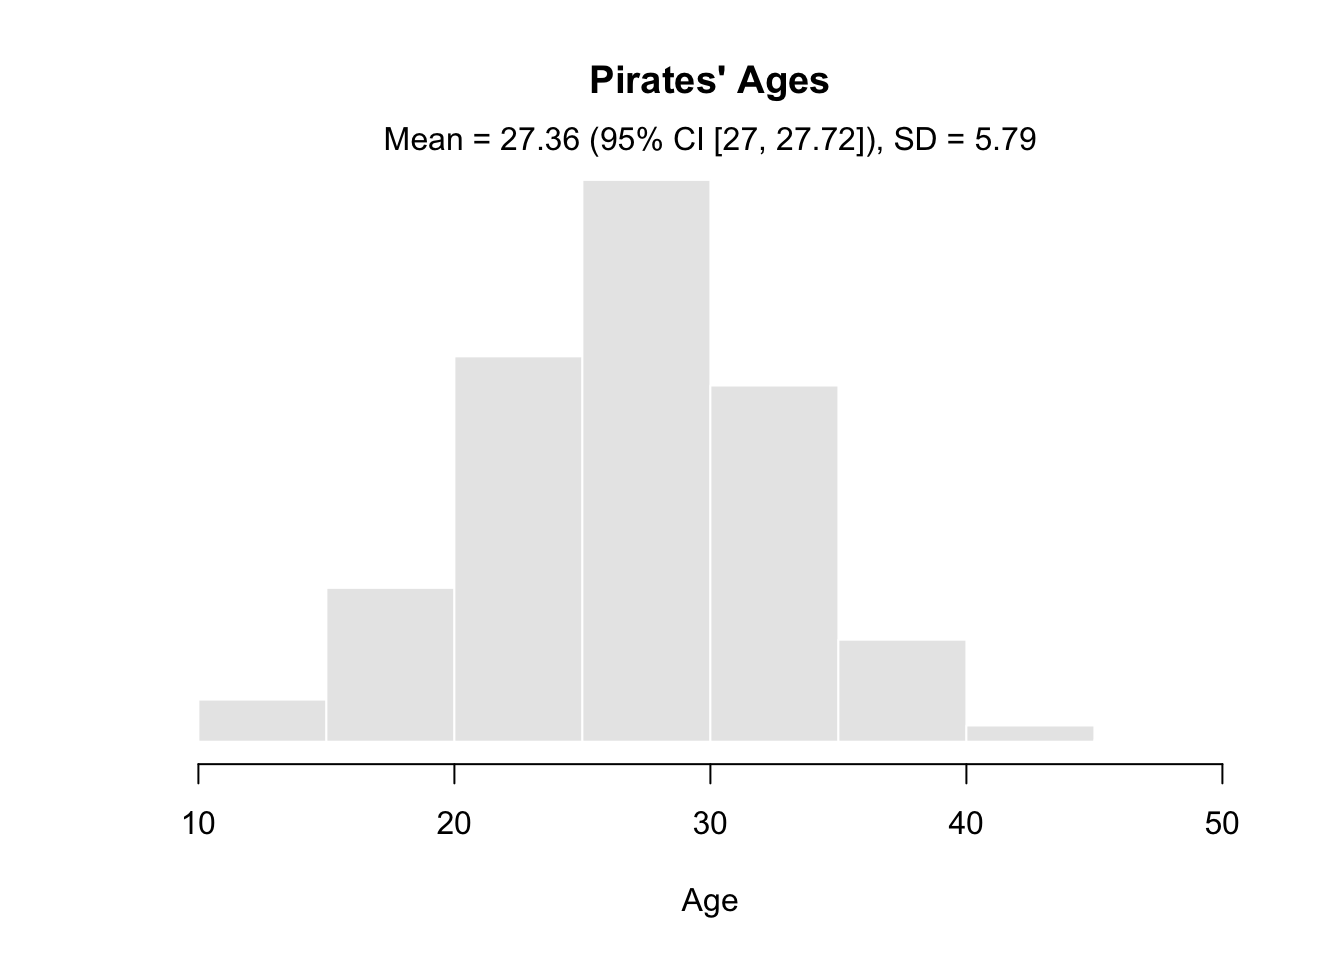
As you can see, the resulting plot has all the customisations I specified in the function. So now, anytime I want to make a fancy pirate-y histogram, I can just use the piratehist() function rather than having to always write all the raw code from scratch.
Of course, functions are limited to creating plots…oh no. You can write a function to do anything that you can program in R. Just think about a function as a container for R-code stored behind the scenes for you to use without having to see (or write) the code again. Now, if there’s anything you like to do repeatedly in R (like making multiple customized plots, you can define the code just once in a new function rather than having to write it all again and again.Some of you reading this will quickly see how how writing your own functions can save you tons of time. For those of you who haven’t…trust me, this is a big deal.