11.1 Colors
Most plotting functions have a color argument (usually col) that allows you to specify the color of whatever your plotting. There are many ways to specify colors in R, let’s start with the easiest ways.
11.1.1 Colors by name
The easiest way to specify a color is to enter its name as a string. For example col = "red" is R’s default version of the color red. Of course, all the basic colors are there, but R also has tons of quirky colors like "snow", "papayawhip" and "lawngreen". Figure 11.2 shows 100 randomly selected named colors.
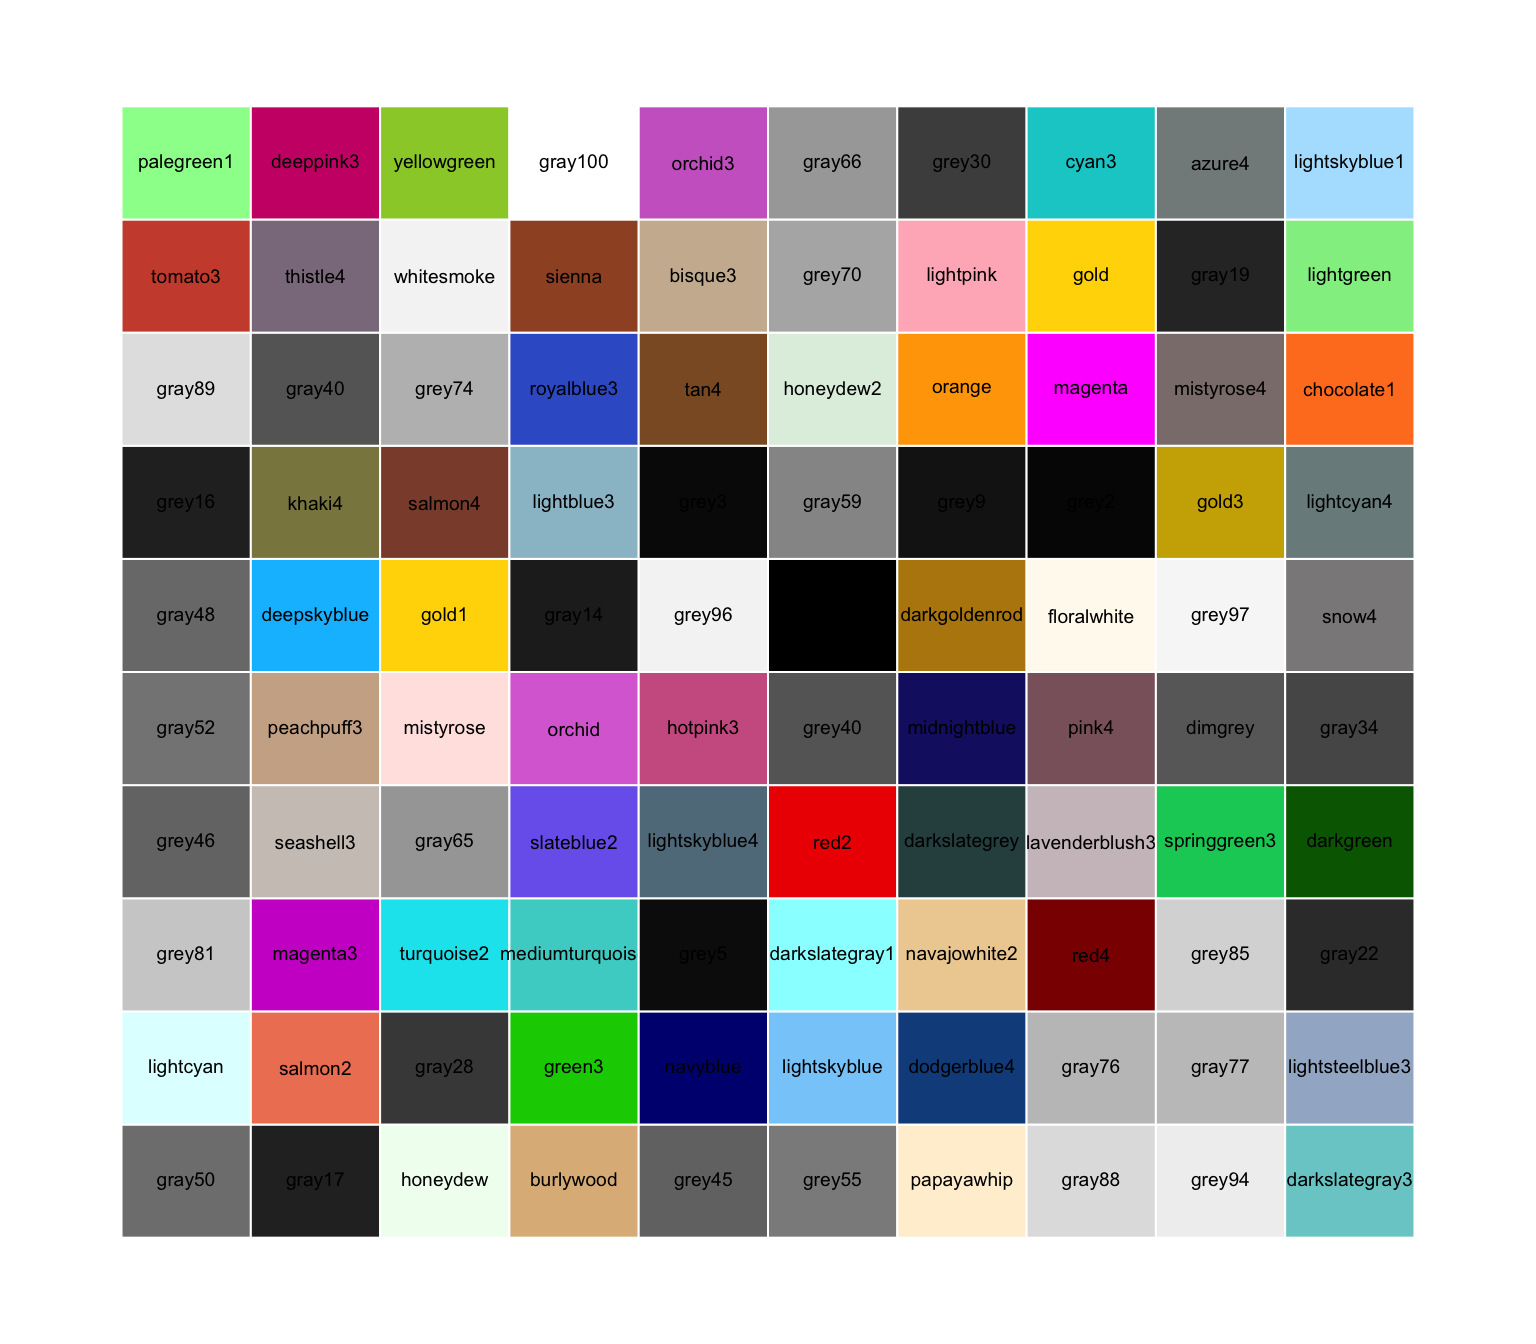
Figure 11.2: 100 random named colors (out of all 657) in R.
To see all 657 color names in R, run the code colors(). Or to see an interactive demo of colors, run demo("colors").
11.1.2 gray()
| Argument | Description |
|---|---|
level |
Lightness: level = 1 = totally white, level = 0 = totally black |
alpha |
Transparency: alpha = 0 = totally transparent, alpha = 1 = not transparent at all. |
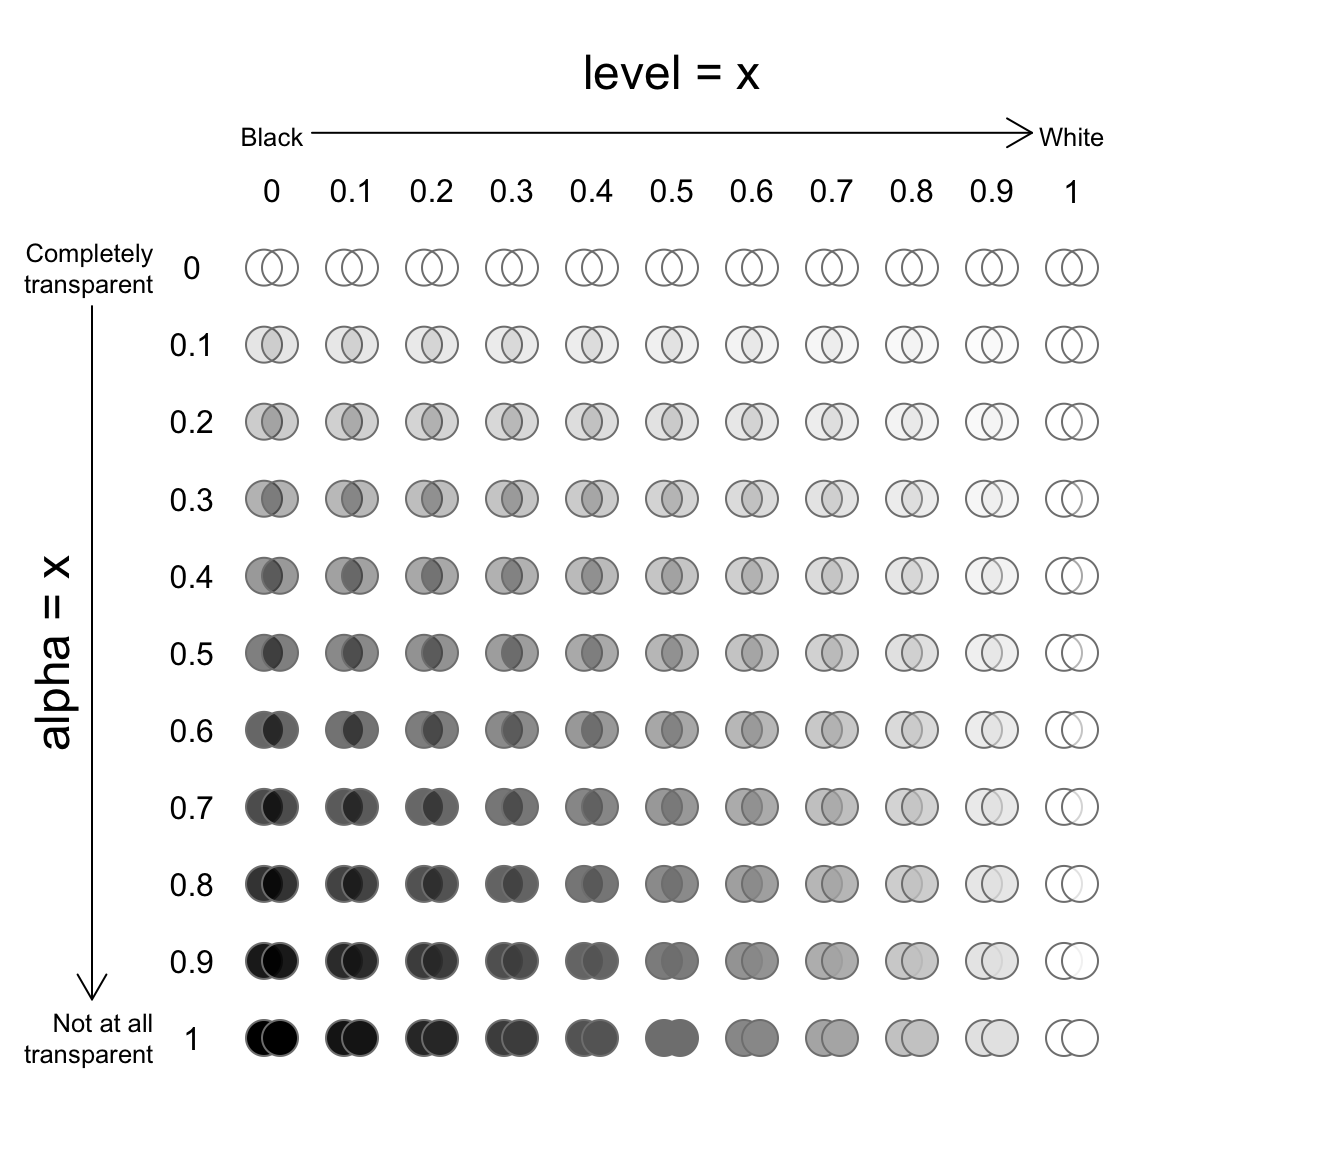
Figure 11.3: Examples of gray(level, alpha)
If you’re into erotic romance and BDSM, then you might be interested in Shades of Gray. If so, the function is your answer. The gray() function takes two arguments, level and alpha, and returns a shade of gray. For example, gray(level = 1) will return white. The second alpha argument specifies how transparent to make the color on a scale from 0 (completely transparent), to 1 (not transparent at all). The default value for alpha is 1 (not transparent at all). See Figure 11.3 for examples.
11.1.3 yarrr::transparent()
I don’t know about you, but I almost always find transparent colors to be more appealing than solid colors. Not only do they help you see when multiple points are overlapping, but they’re just much nicer to look at. Just look at the overlapping circles in the plot below.
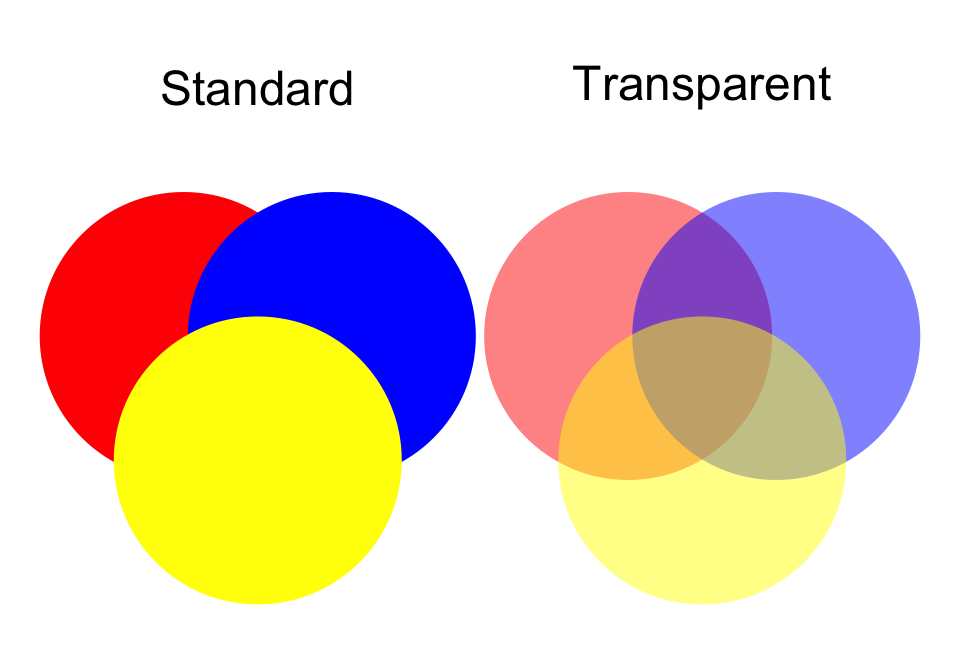
Unfortunately, as far as I know, base-R does not make it easy to make transparent colors. Thankfully, there is a function in the yarrr package called transparent that makes it very easy to make any color transparent. To use it, just enter the original color as the main argument orig.col, then enter how transparent you want to make it (from 0 to 1) as the second argument trans.val.
Here is a basic scatterplot with standard (non-transparent) colors:
# Plot with Standard Colors
plot(x = pirates$height,
     y = pirates$weight,
     col = "blue",
     pch = 16,
     main = "col ='blue'")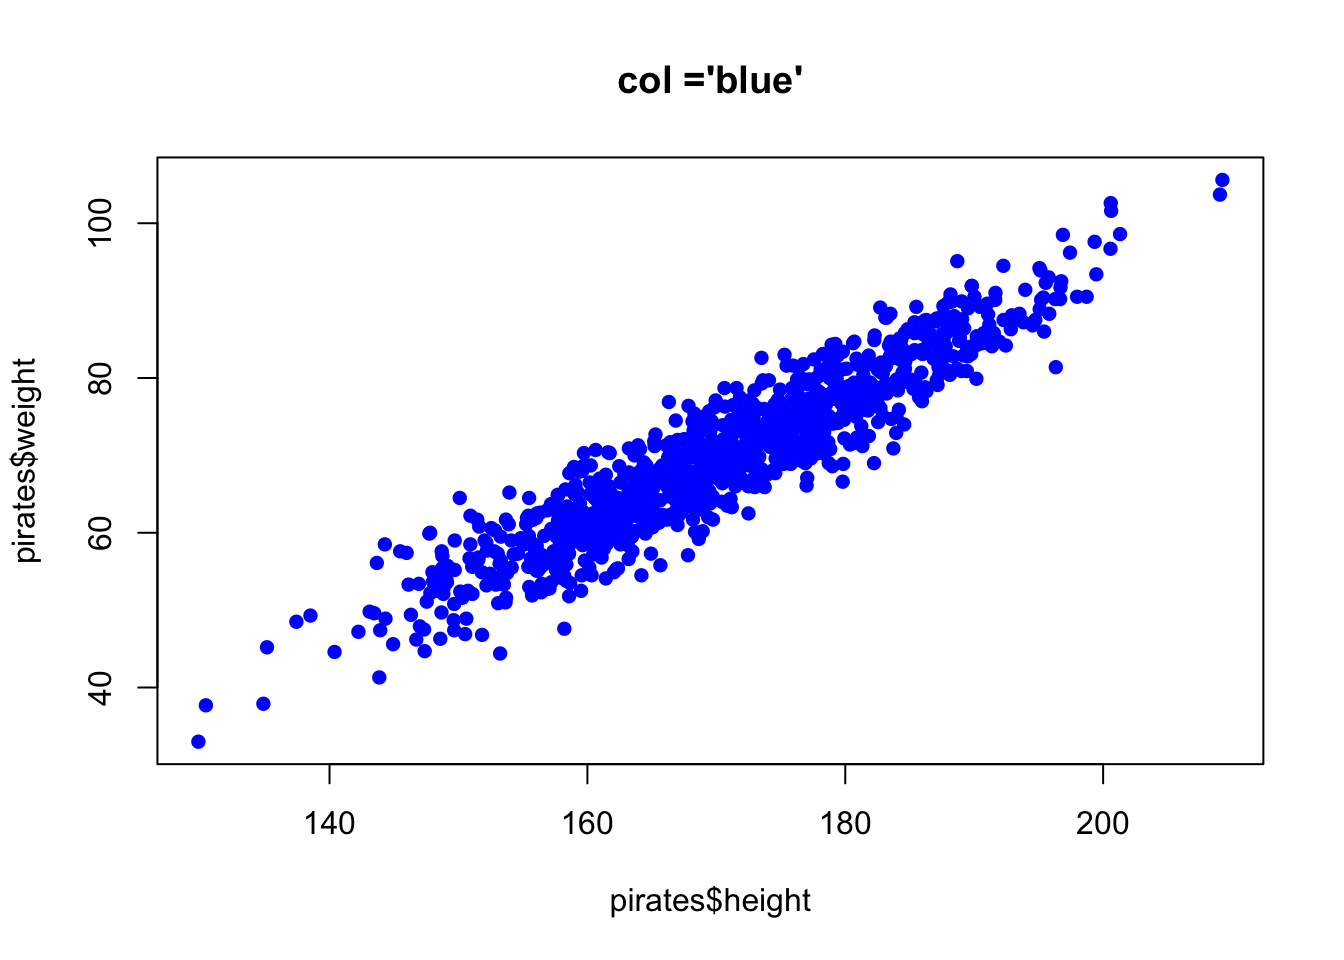
Now here’s the same plot using the transparent() function in the yarrr package:
# Plot with transparent colors using the transparent() function in the yarrr package
plot(x = pirates$height,
     y = pirates$weight,
     col = yarrr::transparent("blue", trans.val = .9),
     pch = 16,
     main = "col = yarrr::transparent('blue', .9)")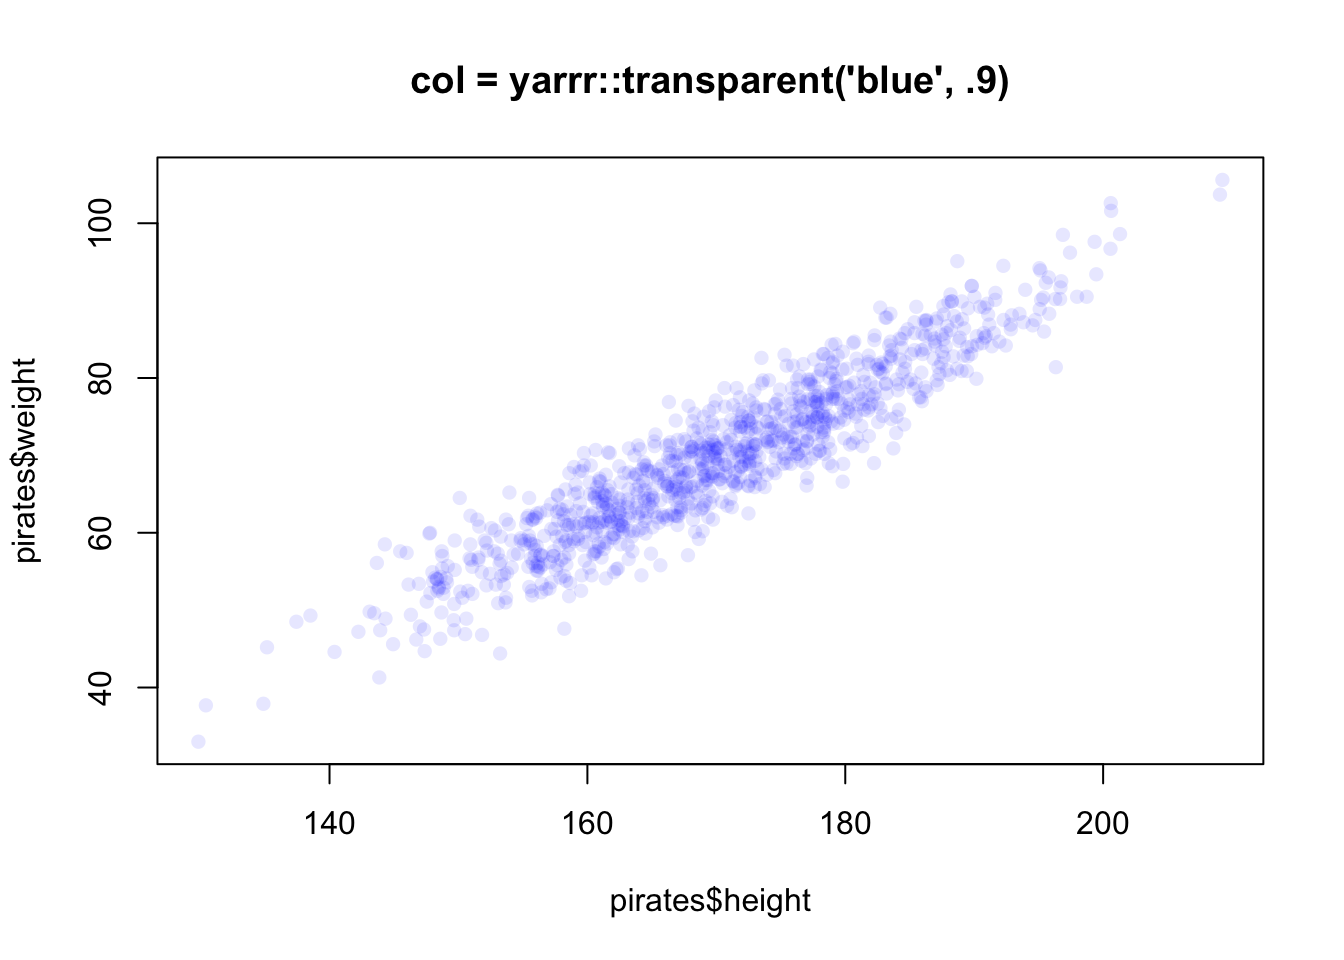
Later on in the book, we’ll cover more advanced ways to come up with colors using color palettes (using the RColorBrewer package or the piratepal() function in the yarrr package) and functions that generate shades of colors based on numeric data (like the colorRamp2() function in the circlize package).