16.3 Using if, then statements in functions
A good function is like a person who knows what to wear for each occasion – it should put on different things depending on the occasion. In other words, rather than doing (i.e.; wearing) a tuxedo for every event, a good dress() function needs to first make sure that the input was (event == "ball") rather than (event == "jobinterview"). To selectively evaluate code based on criteria, R uses if-then statements
To run an if-then statement in R, we use the if() {} function. The function has two main elements, a logical test in the parentheses, and conditional code in curly braces. The code in the curly braces is conditional because it is only evaluated if the logical test contained in the parentheses is TRUE. If the logical test is FALSE, R will completely ignore all of the conditional code.
Let’s put some simple if() {} statements in a new function called is.it.true(). The function will take a single input x. If the input x is TRUE, the function will print one sentence. If the input x is FALSE, it will return a different sentence:
is.it.true <- function(x) {

if(x == TRUE) {print("x was true!")}
if(x == FALSE) {print("x was false!")}

}
Let’s try evaluating the function on a few different inputs:
is.it.true(TRUE)
## [1] "x was true!"
is.it.true(FALSE)
## [1] "x was false!"
is.it.true(10 > 0)
## [1] "x was true!"
is.it.true(10 < 0)
## [1] "x was false!"
Using if() statements in your functions can allow you to do some really neat things. Let’s create a function called show.me() that takes a vector of data, and either creates a plot, tells the user some statistics, or tells a joke! The function has two inputs: x – a vector of data, and what – a string value that tells the function what to do with x. We’ll set the function up to accept three different values of what – either "plot", which will plot the data, "stats", which will return basic statistics about the vector, or "tellmeajoke", which will return a funny joke!
show.me <- function(x, what) {

if(what == "plot") {

  hist(x, yaxt = "n", ylab = "", border = "white",
       col = "skyblue", xlab = "",
       main = "Ok! I hope you like the plot...")

}

if(what == "stats") {

  print(paste("Yarr! The mean of this data be ",
                  round(mean(x), 2),
              " and the standard deviation be ",
              round(sd(x), 2),
              sep = ""))

}

if(what == "tellmeajoke") {

  print("I am a pirate, not your joke monkey.")

}
}
Let’s try the show.me() function with different arguments:
show.me(x = pirates$beard.length,
        what = "plot")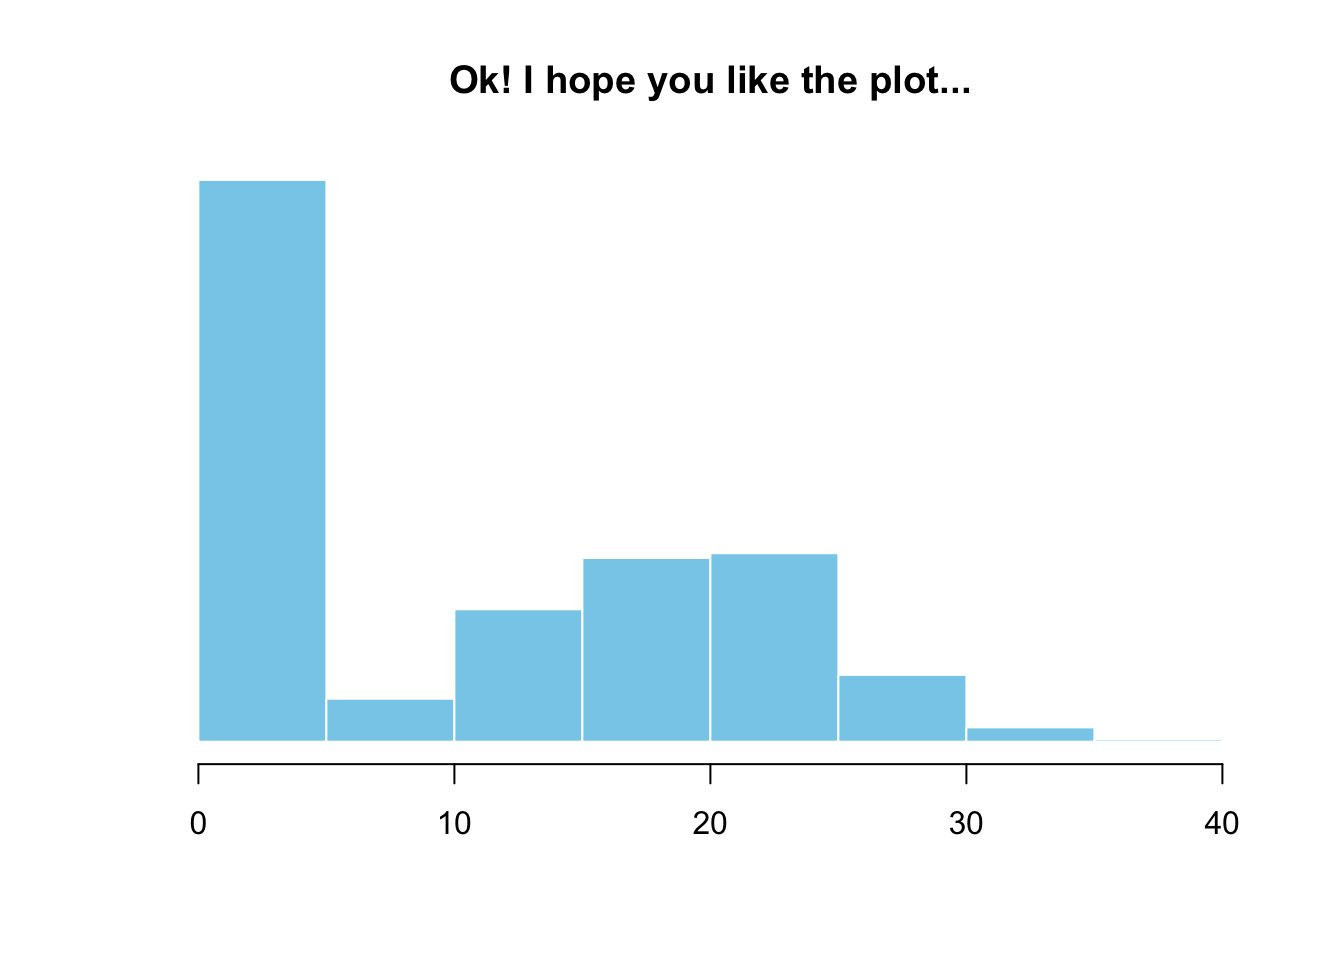
Looks good! Now let’s get the same function to tell us some statistics about the data by setting what = "stats":
show.me(x = pirates$beard.length,
        what = "stats")
## [1] "Yarr! The mean of this data be 10.38 and the standard deviation be 10.31"
Phew that was exhausting, I need to hear a funny joke. Let’s set what = "tellmeajoke":
show.me(what = "tellmeajoke")
## [1] "I am a pirate, not your joke monkey."
That wasn’t very funny.