16.5 Test your R might!
- Captain Jack is convinced that he can predict how much gold he will find on an island with the following equation:
(a * b) - c * 324 + log(a), where a is the area of the island in square meters, b is the number of trees on the island, and c is how drunk he is on a scale of 1 to 10. Create a function calledJacks.Equationthat takes a, b, and c as arguments and returns Captain Jack’s predictions. Here is an example ofJacks.Equationin action:
Jacks.Equation(a = 1000, b = 30, c = 7)
## [1] 27739- Write a function called
standardize.methat takes a vector x as an argument, and returns a vector that standardizes the values of x (standardization means subtracting the mean and dividing by the standard deviation). Here is an example ofstandardize.mein action:
standardize.me(c(1, 2, 1, 100))
## [1] -0.51 -0.49 -0.51 1.50- Often times you will need to recode values of a dataset. For example, if you have a survey of age data, you may want to convert any crazy values (like anything below 0 or above 100) to NA. Write a function called
recode.numeric()with 3 arguments:x,lb, andub. We’ll assume that x is a numeric vector. The function should look at the values of x, convert any values belowlband aboveubto NA, and then return the resulting vector. Here is the function in action:
recode.numeric(x = c(5, 3, -5, 4, 3, 97),
               lb = 0,
               ub = 10)
## [1]  5  3 NA  4  3 NA
Create a function called
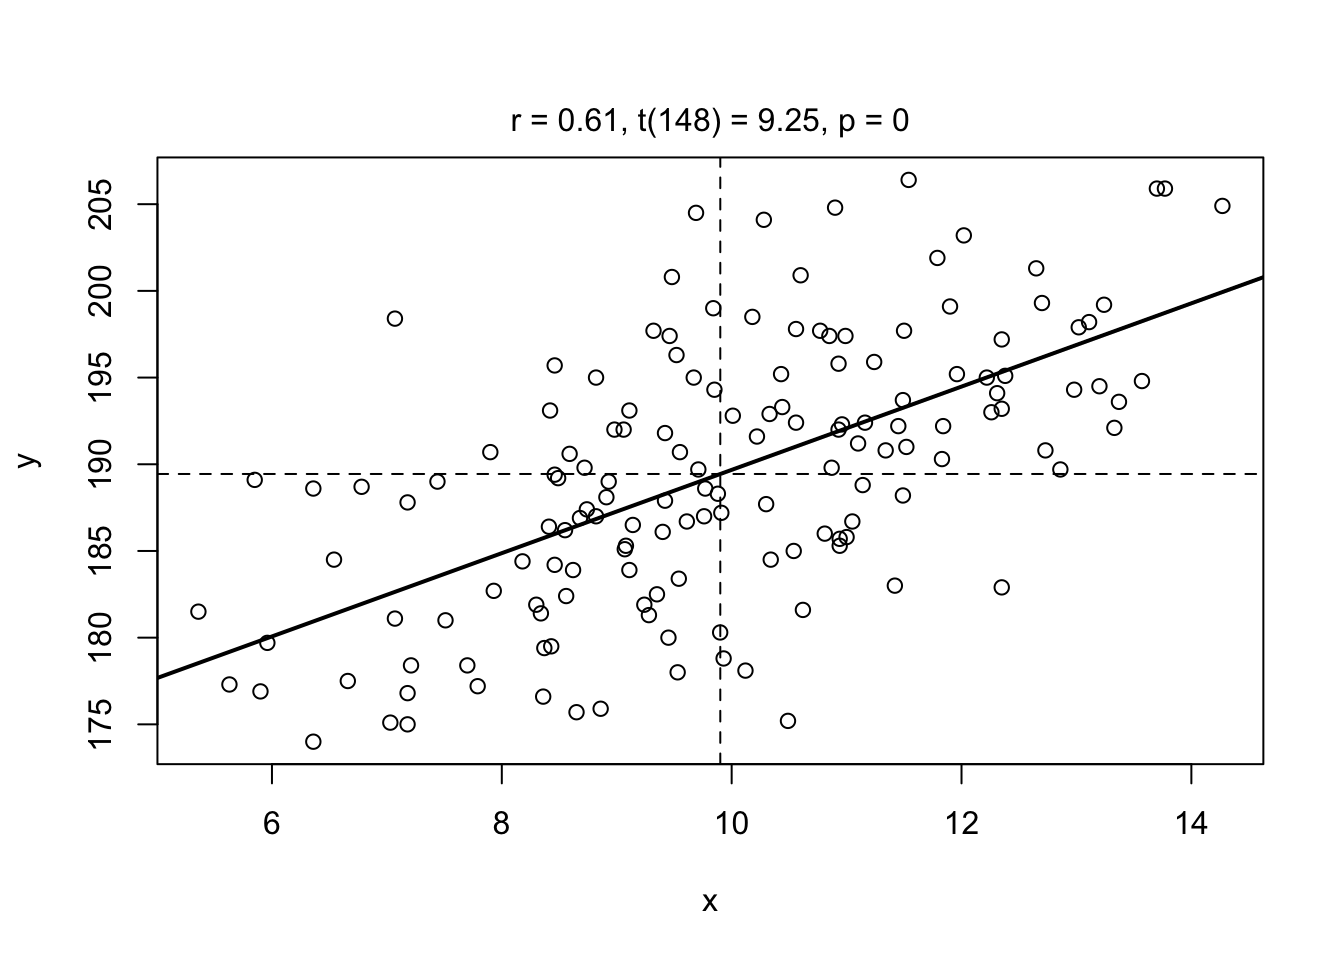
plot.advancedthat creates a scatterplot with the following arguments:add.regression, a logical value indicating whether or not to add a regression line to the plot.add.means, a logical value indicating whether or not to add a vertical line at the mean x value and a horizontal line at mean y value.add.test, a logical value indicating whether or not to add text to the top margin of the plot indicating the result of a correlation test between x and y. (Hint: usemtext()andpaste()to add the text)
Here is my version of plot.advanced() in action:
plot.advanced(x = diamonds$weight,
              y = diamonds$value,
              add.regression = TRUE,
              add.means = TRUE,
              add.test = TRUE)