8.3 Matrix and dataframe functions
R has lots of functions for viewing matrices and dataframes and returning information about them. Table 8.3 shows some of the most common:
| Function | Description |
|---|---|
head(x), tail(x) |
Print the first few rows (or last few rows). |
View(x) |
Open the entire object in a new window |
nrow(x), ncol(x), dim(x) |
Count the number of rows and columns |
rownames(), colnames(), names() |
Show the row (or column) names |
str(x), summary(x) |
Show the structure of the dataframe (ie., dimensions and classes) and summary statistics |
8.3.1 head(), tail(), View()
To see the first few rows of a dataframe, use head(), to see the last few rows, use tail()
# head() shows the first few rows
head(ChickWeight)
## Grouped Data: weight ~ Time | Chick
##   weight Time Chick Diet
## 1     42    0     1    1
## 2     51    2     1    1
## 3     59    4     1    1
## 4     64    6     1    1
## 5     76    8     1    1
## 6     93   10     1    1

# tail() shows he last few rows
tail(ChickWeight)
## Grouped Data: weight ~ Time | Chick
##     weight Time Chick Diet
## 573    155   12    50    4
## 574    175   14    50    4
## 575    205   16    50    4
## 576    234   18    50    4
## 577    264   20    50    4
## 578    264   21    50    4
To see an entire dataframe in a separate window that looks like spreadsheet, use View()
# View() opens the entire dataframe in a new window
View(ChickWeight)
When you run View(), you’ll see a new window like the one in Figure 8.3
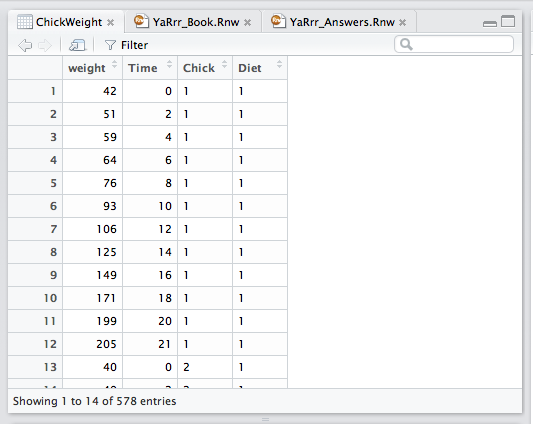
Figure 8.3: Screenshot of the window from View(ChickWeight). You can use this window to visually sort and filter the data to get an idea of how it looks, but you can’t add or remove data and nothing you do will actually change the dataframe.
8.3.2 summary(), str()
To get summary statistics on all columns in a dataframe, use the summary() function:
# Print summary statistics of ToothGrowth to the console
summary(ToothGrowth)
##       len     supp         dose          len.cm        index
##  Min.   : 4   OJ:30   Min.   :0.50   Min.   :0.4   Min.   : 1
##  1st Qu.:13   VC:30   1st Qu.:0.50   1st Qu.:1.3   1st Qu.:16
##  Median :19           Median :1.00   Median :1.9   Median :30
##  Mean   :19           Mean   :1.17   Mean   :1.9   Mean   :30
##  3rd Qu.:25           3rd Qu.:2.00   3rd Qu.:2.5   3rd Qu.:45
##  Max.   :34           Max.   :2.00   Max.   :3.4   Max.   :60
To learn about the classes of columns in a dataframe, in addition to some other summary information, use the str() (structure) function. This function returns information for more advanced R users, so don’t worry if the output looks confusing.
# Print additional information about ToothGrowth to the console
str(ToothGrowth)
## 'data.frame':    60 obs. of  5 variables:
##  $ len   : num  4.2 11.5 7.3 5.8 6.4 10 11.2 11.2 5.2 7 ...
##  $ supp  : Factor w/ 2 levels "OJ","VC": 2 2 2 2 2 2 2 2 2 2 ...
##  $ dose  : num  0.5 0.5 0.5 0.5 0.5 0.5 0.5 0.5 0.5 0.5 ...
##  $ len.cm: num  0.42 1.15 0.73 0.58 0.64 1 1.12 1.12 0.52 0.7 ...
##  $ index : int  1 2 3 4 5 6 7 8 9 10 ...
Here, we can see that ToothGrowth is a dataframe with 60 observations (ie., rows) and 5 variables (ie., columns). We can also see that the column names are index, len, len.cm, supp, and dose