17.2 Creating multiple plots with a loop
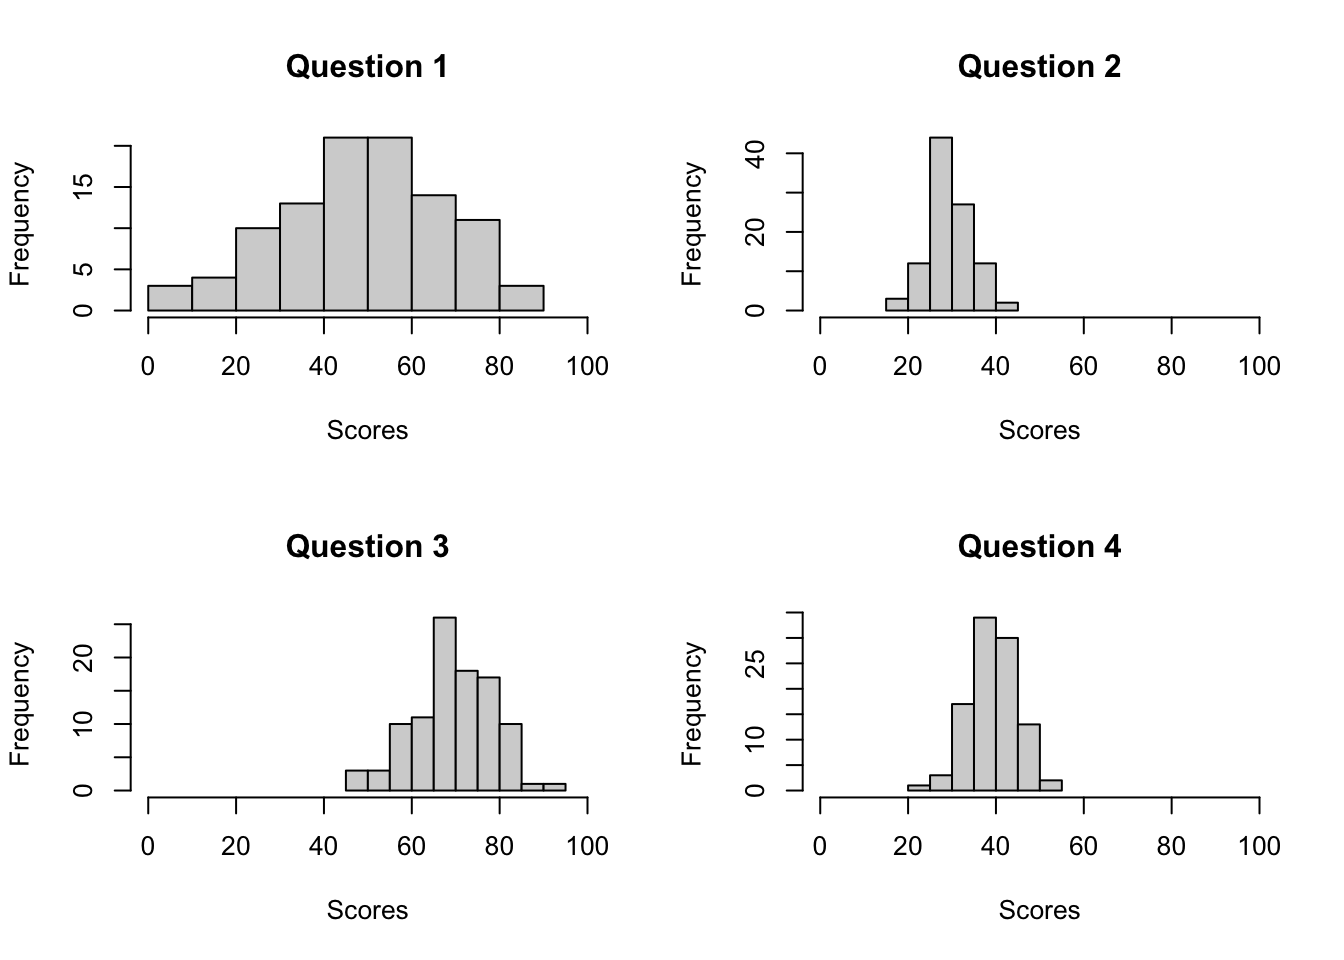
One of the best uses of a loop is to create multiple graphs quickly and easily. Let’s use a loop to create 4 plots representing data from an exam containing 4 questions. The data are represented in a matrix with 100 rows (representing 100 different people), and 4 columns representing scores on the different questions. The data are stored in the yarrr package in an object called examscores. Here are how the first few rows of the data look
# First few rows of the examscores data
head(examscores)
##    a  b  c  d
## 1 43 31 68 34
## 2 61 27 56 39
## 3 37 41 74 46
## 4 54 36 62 41
## 5 56 34 82 40
## 6 73 29 79 35
Now, we’ll loop over the columns and create a histogram of the data in each column. First, I’ll set up a 2 x 2 plotting space with par(mfrow()) (If you haven’t seen par(mfrow()) before, just know that it allows you to put multiple plots side-by-side). Next, I’ll define the loop object as i, and the loop vector as the integers from 1 to 4 with 1:4. In the loop code, I stored the data in column i as a new vector x. Finally, I created a histogram of the object x!
par(mfrow = c(2, 2))  # Set up a 2 x 2 plotting space

# Create the loop.vector (all the columns)
loop.vector <- 1:4

for (i in loop.vector) { # Loop over loop.vector

  # store data in column.i as x
  x <- examscores[,i]

  # Plot histogram of x
  hist(x,
       main = paste("Question", i),
       xlab = "Scores",
       xlim = c(0, 100))
}