8.1 What are matrices and dataframes?
By now, you should be comfortable with scalar and vector objects. However, you may have noticed that neither object types are appropriate for storing lots of data – such as the results of a survey or experiment. Thankfully, R has two object types that represent large data structures much better: matrices and dataframes.
Matrices and dataframes are very similar to spreadsheets in Excel or data files in SPSS. Every matrix or dataframe contains rows (call that number m) and columns (n). Thus, wile a vector has 1 dimension (its length), matrices and dataframes both have 2-dimensions – representing their width and height. You can think of a matrix or dataframe as a combination of n vectors, where each vector has a length of m.
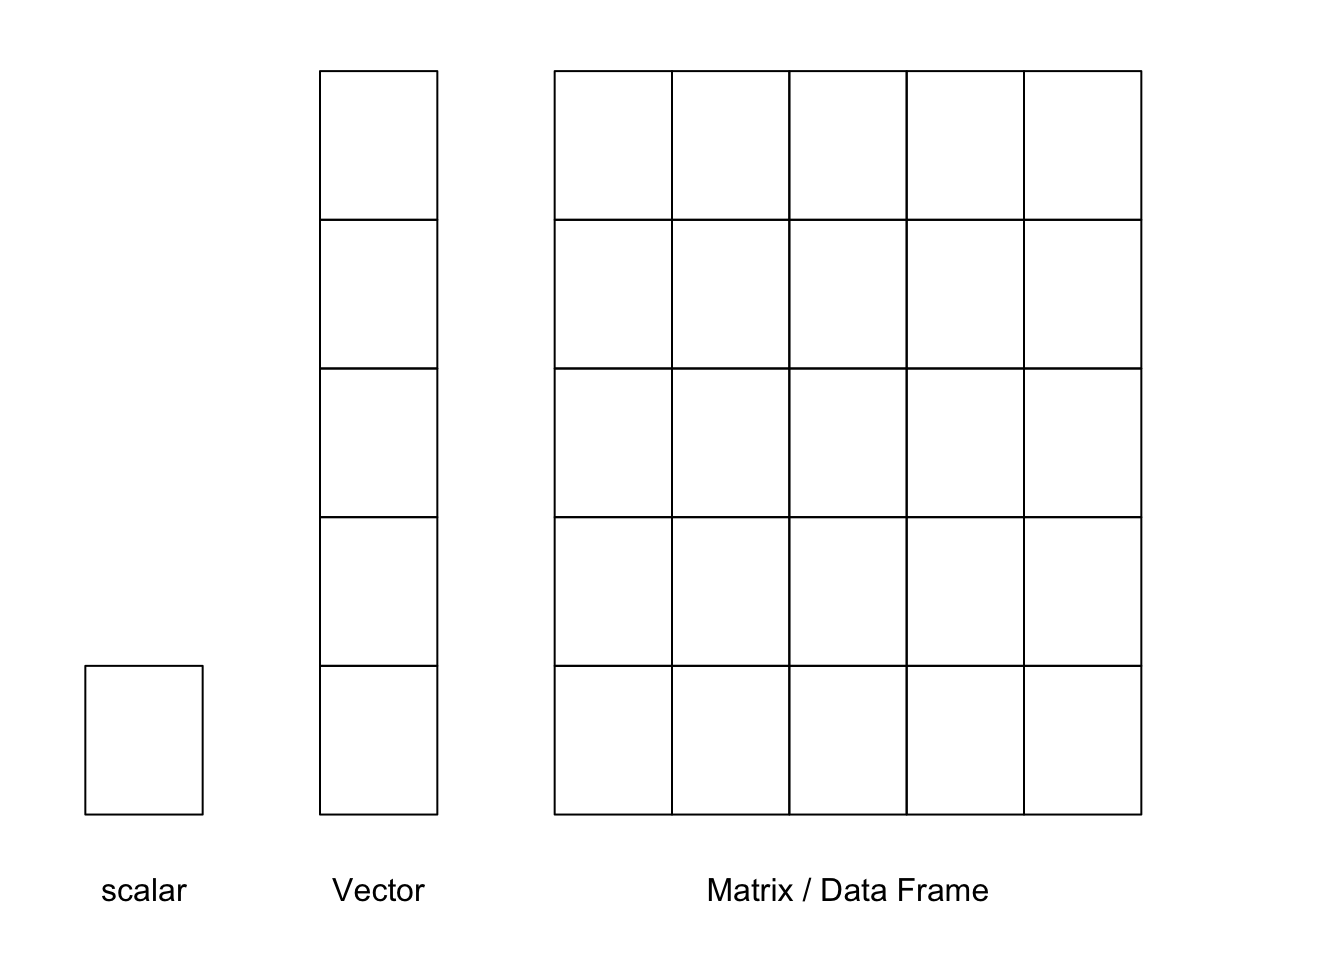
Figure 8.2: scalar, Vector, MATRIX
While matrices and dataframes look very similar, they aren’t exactly the same. While a matrix can contain either character or numeric columns, a dataframe can contain both numeric and character columns. Because dataframes are more flexible, most real-world datasets, such as surveys containing both numeric (e.g.; age, response times) and character (e.g.; sex, favorite movie) data, will be stored as dataframes in R.
WTF – If dataframes are more flexible than matrices, why do we use matrices at all? The answer is that, because they are simpler, matrices take up less computational space than dataframes. Additionally, some functions require matrices as inputs to ensure that they work correctly.
In the next section, we’ll cover the most common functions for creating matrix and dataframe objects. We’ll then move on to functions that take matrices and dataframes as inputs.