13.4 Correlation: cor.test()
| Argument | Description |
|---|---|
formula |
A formula in the form ~ x + y, where x and y are the names of the two variables you are testing. These variables should be two separate columns in a dataframe. |
data |
The dataframe containing the variables x and y |
alternative |
A string specifying the alternative hypothesis. Can be "two.sided" indicating a two-tailed test, or "greater" or “less" for a one-tailed test. |
method |
A string indicating which correlation coefficient to calculate and test. "pearson" (the default) stands for Pearson, while "kendall" and "spearman" stand for Kendall and Spearman correlations respectively. |
subset |
A vector specifying a subset of observations to use. E.g.; subset = sex == "female" |
Next we’ll cover two-sample correlation tests. In a correlation test, you are accessing the relationship between two variables on a ratio or interval scale: like height and weight, or income and beard length. The test statistic in a correlation test is called a correlation coefficient and is represented by the letter r. The coefficient can range from -1 to +1, with -1 meaning a strong negative relationship, and +1 meaning a strong positive relationship. The null hypothesis in a correlation test is a correlation of 0, which means no relationship at all:
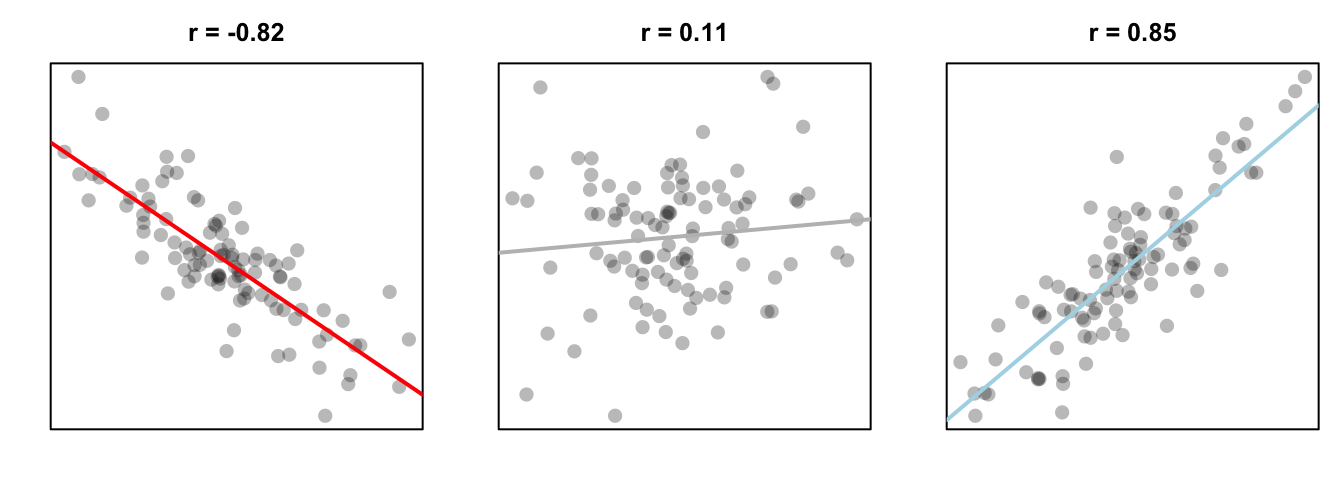
Figure 13.5: Three different correlations. A strong negative correlation, a very small positive correlation, and a strong positive correlation.
To run a correlation test between two variables x and y, use the cor.test() function. You can do this in one of two ways, if x and y are columns in a dataframe, use the formula notation (formula = ~ x + y). If x and y are separate vectors (not in a dataframe), use the vector notation (x, y):
# Correlation Test
#   Correlating two variables x and y

# Method 1: Formula notation
##  Use if x and y are in a dataframe
cor.test(formula = ~ x + y,
         data = df)

# Method 2: Vector notation
## Use if x and y are separate vectors
cor.test(x = x,
         y = y)
Let’s conduct a correlation test on the pirates dataset to see if there is a relationship between a pirate’s age and number of parrots they’ve had in their lifetime. Because the variables (age and parrots) are in a dataframe, we can do this in formula notation:
# Is there a correlation between a pirate's age and
#  the number of parrots (s)he's owned?

# Method 1: Formula notation
age.parrots.ctest <- cor.test(formula = ~ age + parrots,
                             data = pirates)
# Print result
age.parrots.ctest
##
##  Pearson's product-moment correlation
##
## data:  age and parrots
## t = 6, df = 1000, p-value = 1e-09
## alternative hypothesis: true correlation is not equal to 0
## 95 percent confidence interval:
##  0.13 0.25
## sample estimates:
##  cor
## 0.19
We can also do the same thing using vector notation – the results will be exactly the same:
# Method 2: Vector notation
age.parrots.ctest <- cor.test(x = pirates$age,
                             y = pirates$parrots)

# Print result
age.parrots.ctest
##
##  Pearson's product-moment correlation
##
## data:  pirates$age and pirates$parrots
## t = 6, df = 1000, p-value = 1e-09
## alternative hypothesis: true correlation is not equal to 0
## 95 percent confidence interval:
##  0.13 0.25
## sample estimates:
##  cor
## 0.19
Looks like we have a positive correlation of 0.19 and a very small p-value. To see what information we can extract for this test, let’s run the command names() on the test object:
names(age.parrots.ctest)
## [1] "statistic"   "parameter"   "p.value"     "estimate"    "null.value"
## [6] "alternative" "method"      "data.name"   "conf.int"
Looks like we’ve got a lot of information in this test object. As an example, let’s look at the confidence interval for the population correlation coefficient:
#  95% confidence interval of the correlation
#   coefficient
age.parrots.ctest$conf.int
## [1] 0.13 0.25
## attr(,"conf.level")
## [1] 0.95
Just like the t.test() function, we can use the subset argument in the cor.test() function to conduct a test on a subset of the entire dataframe. For example, to run the same correlation test between a pirate’s age and the number of parrot’s she’s owned, but only for female pirates, I can add the subset = sex == "female" argument:
# Is there a correlation between age and
#  number parrots ONLY for female pirates?

cor.test(formula = ~ age + parrots,
         data = pirates,
         subset = sex == "female")
##
##  Pearson's product-moment correlation
##
## data:  age and parrots
## t = 5, df = 500, p-value = 4e-06
## alternative hypothesis: true correlation is not equal to 0
## 95 percent confidence interval:
##  0.12 0.30
## sample estimates:
##  cor
## 0.21
The results look pretty much identical. In other words, the strength of the relationship between a pirate’s age and the number of parrot’s they’ve owned is pretty much the same for female pirates and pirates in general.