Chapter 3 Jump In!
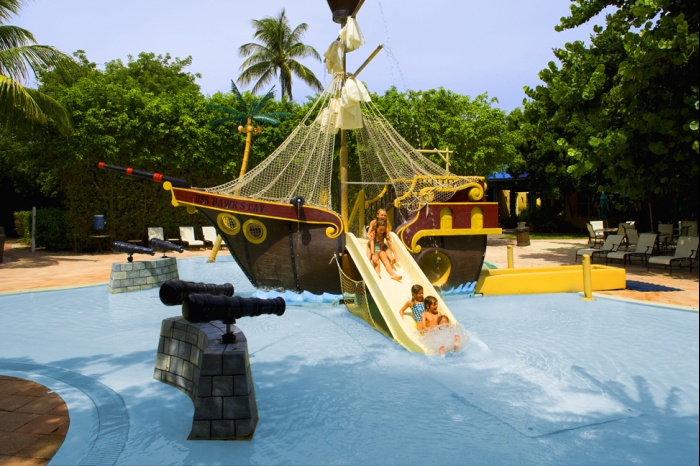
Figure 3.1: Despite what you might find at family friendly waterparks – this is NOT how real pirate swimming lessons look.
What’s the first exercise on the first day of pirate swimming lessons? While it would be cute if they all had little inflatable pirate ships to swim around in – unfortunately this is not the case. Instead, those baby pirates take a walk off their baby planks so they can get a taste of what they’re in for. Turns out, learning R is the same way. Let’s jump in. In this chapter, you’ll see how easy it is to calculate basic statistics and create plots in R. Don’t worry if the code you’re running doesn’t make immediate sense – just marvel at how easy it is to do this in R!
In this section, we’ll analyze a dataset called…wait for it…pirates! The dataset contains data from a survey of 1,000 pirates. The data is contained in the yarrr package, so make sure you’ve installed and loaded the package:
# Install the yarrr package
install.packages('yarrr')

# Load the package
library(yarrr)