11.5 Barplot: barplot()
A barplot typically shows summary statistics for different groups. The primary argument to a barplot is height: a vector of numeric values which will generate the height of each bar. To add names below the bars, use the names.arg argument. For additional arguments specific to barplot(), look at the help menu with ?barplot:
barplot(height = 1:5,  # A vector of heights
        names.arg = c("G1", "G2", "G3", "G4", "G5"), # A vector of names
        main = "Example Barplot",
        xlab = "Group",
        ylab = "Height")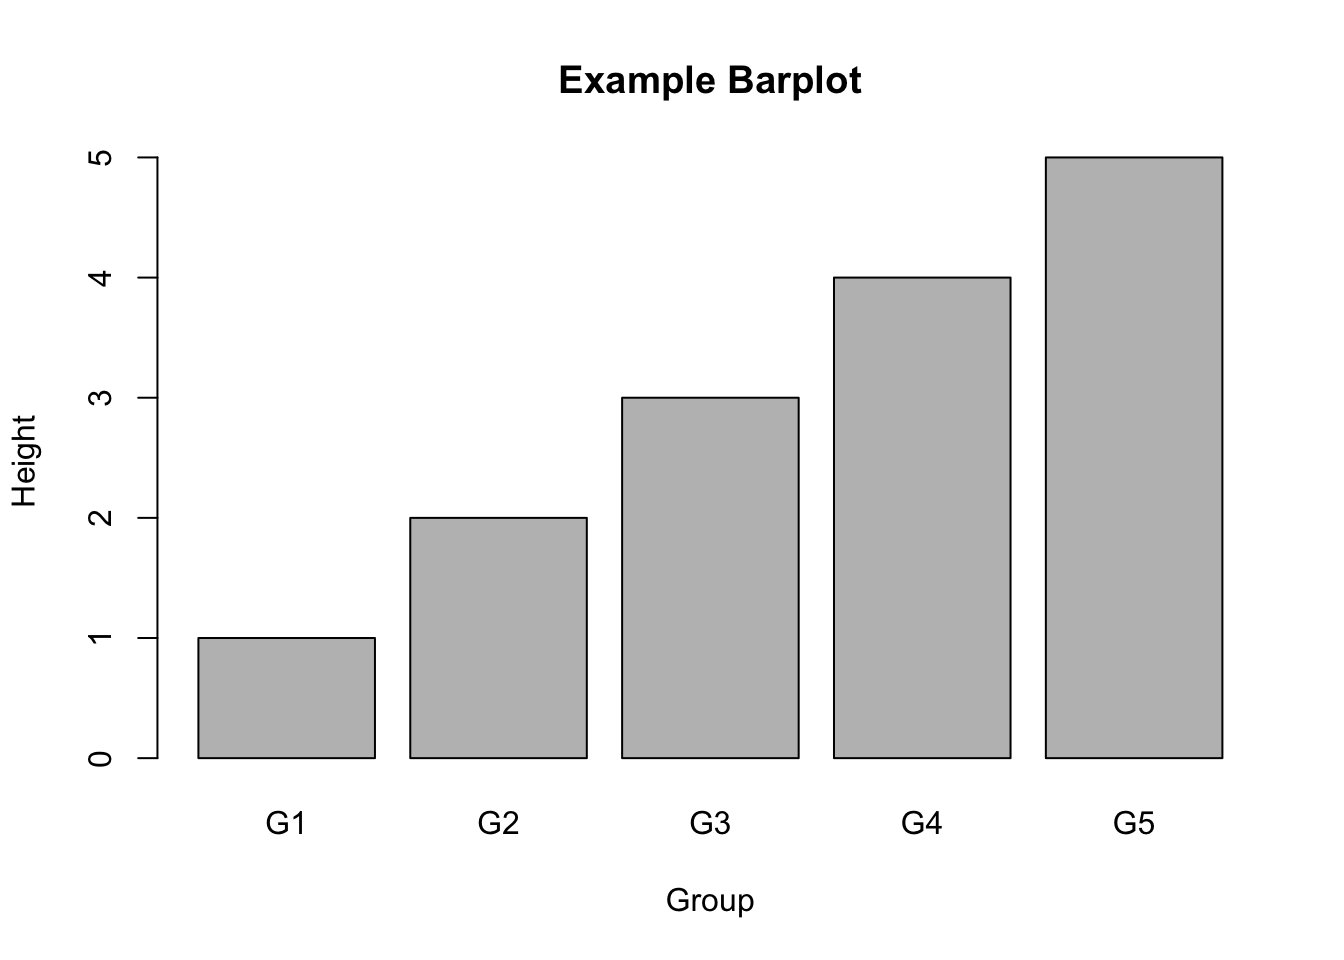
Of course, you should plot more interesting data than just a vector of integers with a barplot. In the plot below, I create a barplot with the average weight of chickens for each week:
# Calculate mean weights for each time period
diet.weights <- aggregate(weight ~ Time,
                      data = ChickWeight,
                      FUN = mean)

# Create barplot
barplot(height = diet.weights$weight,
        names.arg = diet.weights$Time,
        xlab = "Week",
        ylab = "Average Weight",
        main = "Average Chicken Weights by Time",
        col = "mistyrose")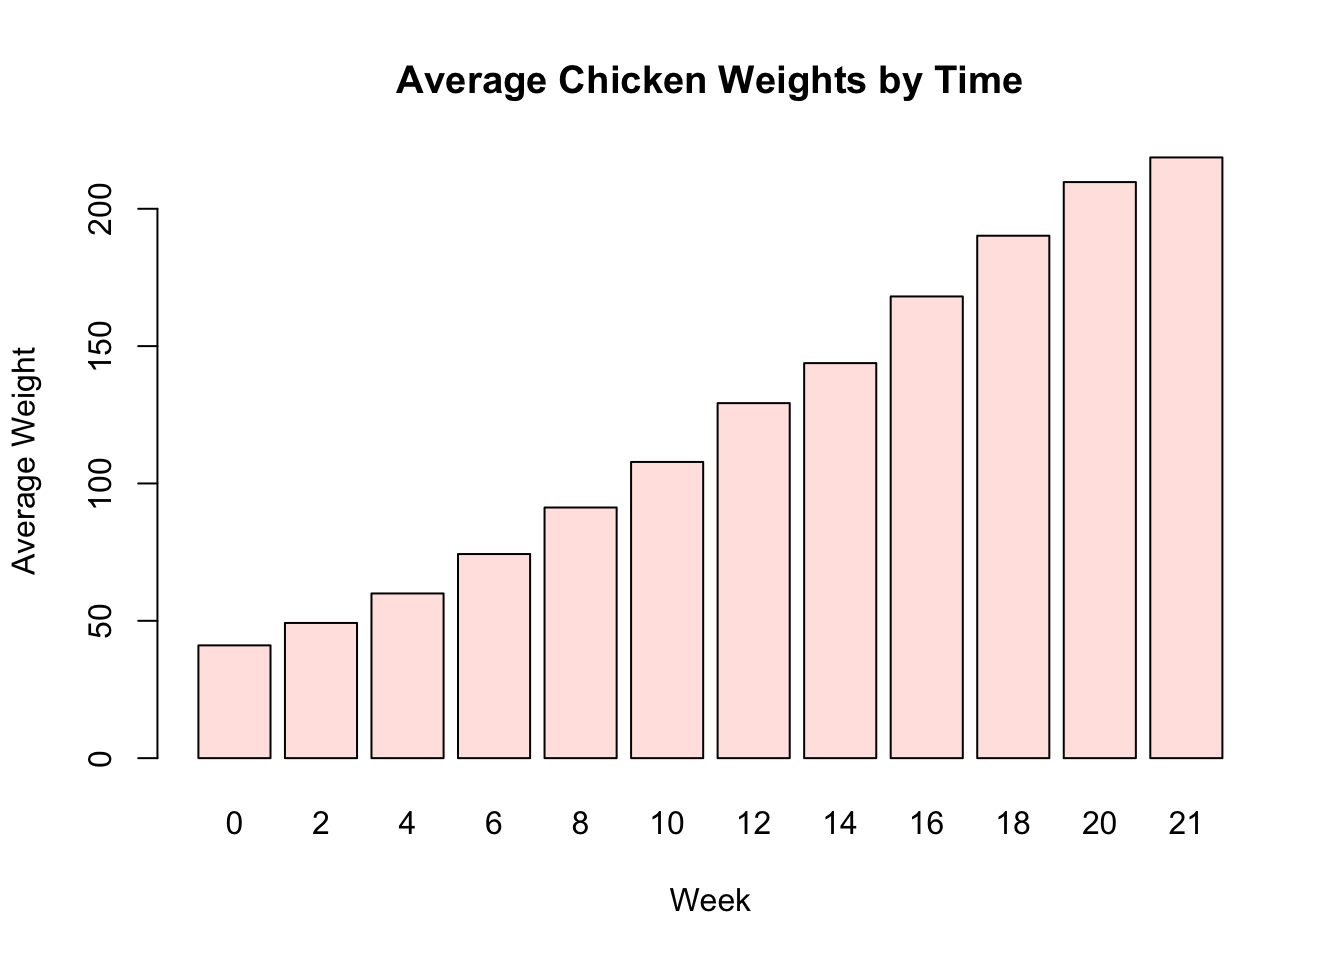
11.5.1 Clustered barplot
If you want to create a clustered barplot, with different bars for different groups of data, you can enter a matrix as the argument to height. R will then plot each column of the matrix as a separate set of bars. For example, let’s say I conducted an experiment where I compared how fast pirates can swim under four conditions: Wearing clothes versus being naked, and while being chased by a shark versus not being chased by a shark. Let’s say I conducted this experiment and calculated the following average swimming speed:
| Naked | Clothed | |
|---|---|---|
| No Shark | 2.1 | 1.5 |
| Shark | 3.0 | 3.0 |
I can represent these data in a matrix as follows. In order for the final barplot to include the condition names, I’ll add row and column names to the matrix with colnames() and rownames()
swim.data <- cbind(c(2.1, 3), # Naked Times
                   c(1.5, 3)) # Clothed Times

colnames(swim.data) <- c("Naked", "Clothed")
rownames(swim.data) <- c("No Shark", "Shark")

# Print result
swim.data
##          Naked Clothed
## No Shark   2.1     1.5
## Shark      3.0     3.0
Now, when I enter this matrix as the height = swim.data argument to barplot(), I’ll get multiple bars.
barplot(height = swim.data,
        beside = TRUE,                        # Put the bars next to each other
        legend.text = TRUE,                   # Add a legend
        col = c(transparent("green", .2),
                transparent("red", .2)),
        main = "Swimming Speed Experiment",
        ylab = "Speed (in meters / second)",
        xlab = "Clothing Condition",
        ylim = c(0, 4))