12.4 Additional plotting parameters
To change the background color of a plot, add the command par(bg = col) (where col is the color you want to use) prior to creating the plot. For example, the following code will put a light gray background behind a histogram:

Here’s a more complex example:
parrot.data <- data.frame(
  "ship" = c("Drunken\nMonkeys", "Slippery\nSnails", "Don't Ask\nDon't Tell", "The Beliebers"),
  "Green" = c(200, 150, 100, 175),
  "Blue " = c(150, 125, 180, 242))

# Set background color and plot margins
par(bg = rgb(61, 55, 72, maxColorValue = 255),
    mar = c(6, 6, 4, 3))

plot(1, xlab = "", ylab = "", xaxt = "n",
     yaxt = "n", main = "", bty = "n", type = "n",
     ylim = c(0, 250), xlim = c(.25, 5.25))

# Add gridlines
abline(h = seq(0, 250, 50),
       lty = 3,
       col = gray(.95), lwd = 1)

# y-axis labels
mtext(text = seq(50, 250, 50),
      side = 2, at = seq(50, 250, 50),
      las = 1, line = 1, col = gray(.95))

# ship labels
mtext(text = parrot.data$ship,
      side = 1, at = 1:4, las = 1,
      line = 1, col = gray(.95))

# Blue bars
rect(xleft = 1:4 - .35 - .04 / 2,
     ybottom = rep(0, 4),
     xright = 1:4 - .04 / 2,
     ytop = parrot.data$Blue,
     col = "lightskyblue1", border = NA)

# Green bars
rect(xleft = 1:4 + .04 / 2,
     ybottom = rep(0, 4),
     xright = 1:4 + .35 + .04 / 2,
     ytop = parrot.data$Green,
     col = "lightgreen", border = NA)

legend(4.5, 250, c("Blue", "Green"),
       col = c("lightskyblue1", "lightgreen"), pch = rep(15, 2),
       bty = "n", pt.cex = 1.5, text.col = "white")

# Additional margin text
mtext("Number of Green and Blue parrots on 4 ships",
      side = 3, cex = 1.5, col = "white")
mtext("Parrots", side = 2, col = "white", line = 3.5)
mtext("Source: Drunken survey on 22 May 2015", side = 1,
      at = 0, adj = 0, line = 3, font = 3, col = "white")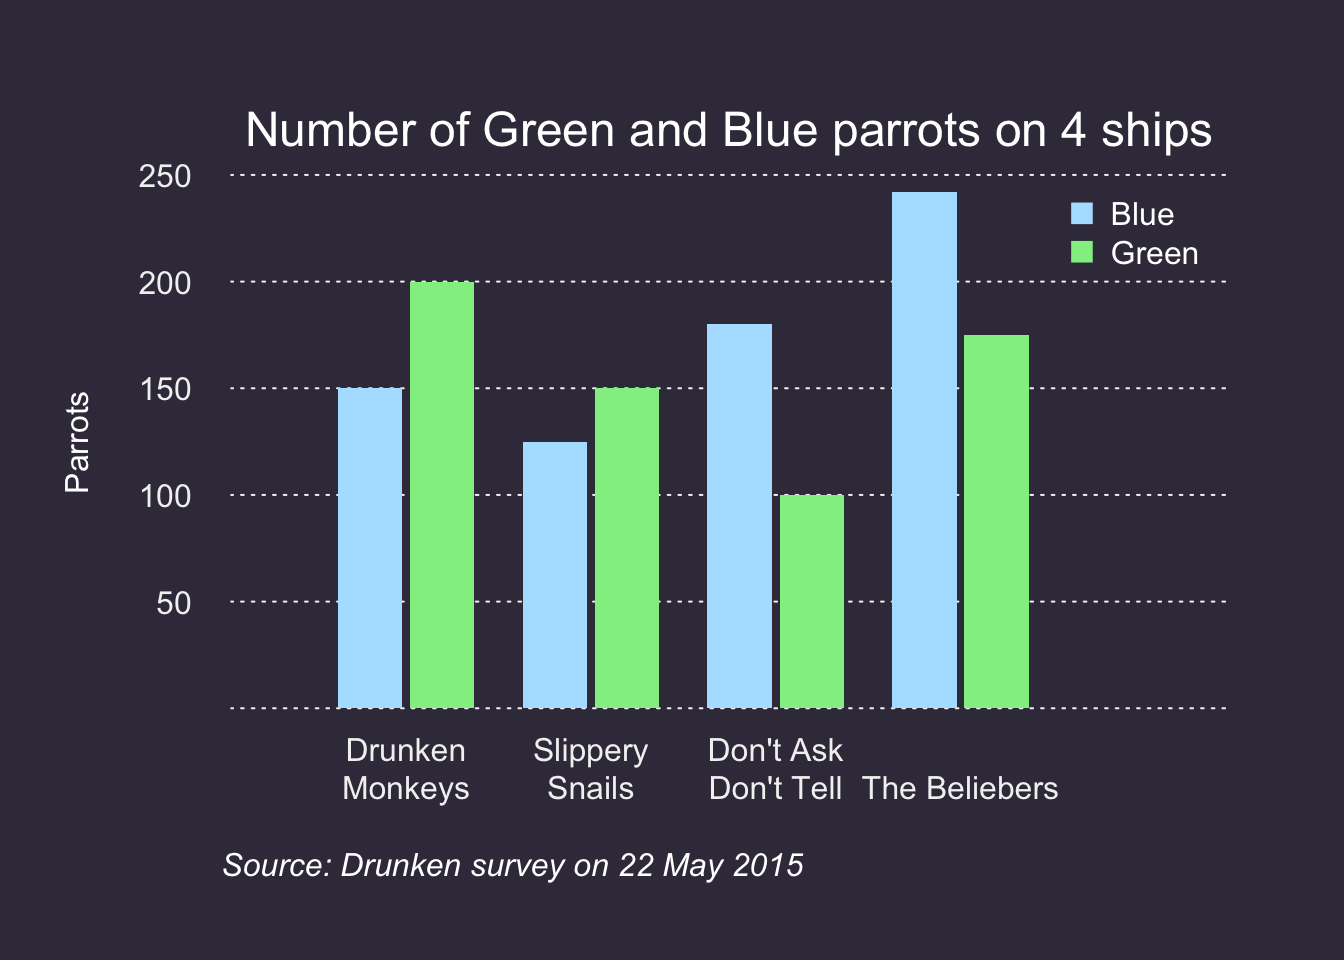
Figure 12.7: Use par(bg = my.color) before creating a plot to add a colored background.