14.3 Ex: One-way ANOVA
Let’s do an example by running both a one-way ANOVA on the poopdeck data. We’ll set cleaning time time as the dependent variable and the cleaner type cleaner as the independent variable. We can represent the data as a pirateplot:
yarrr::pirateplot(time ~ cleaner,
                  data = poopdeck,
                  theme = 2,
                  cap.beans = TRUE,
                  main = "formula = time ~ cleaner")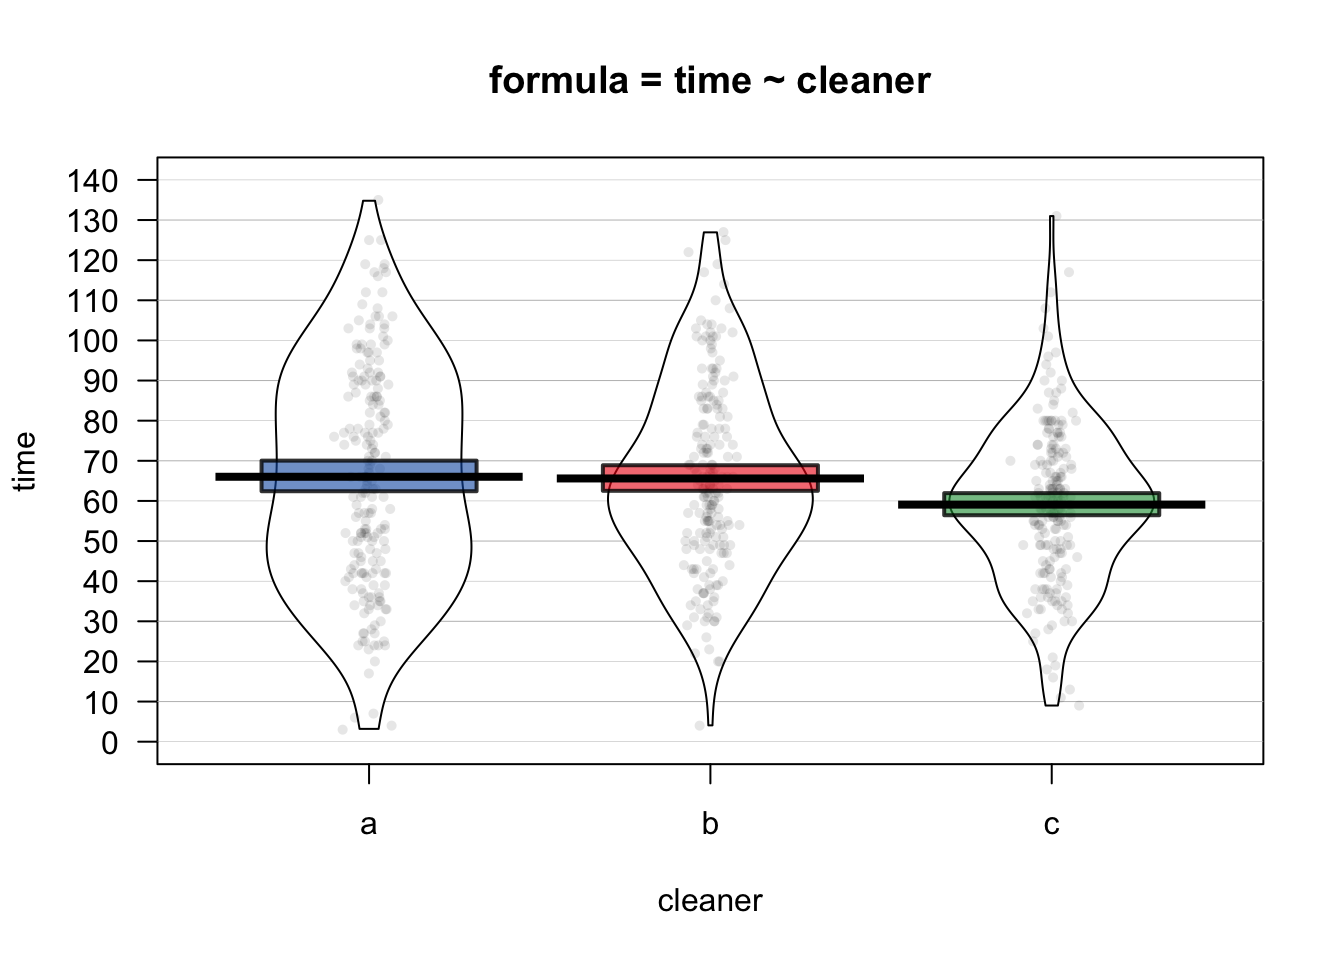
From the plot, it looks like cleaners a and b are the same, and cleaner c is a bit faster. To test this, we’ll create an ANOVA object with aov. Because time is the dependent variable and cleaner is the independent variable, we’ll set the formula to formula = time ~ cleaner
# Step 1: aov object with time as DV and cleaner as IV
cleaner.aov <- aov(formula = time ~ cleaner,
                   data = poopdeck)
Now, to see a full ANOVA summary table of the ANOVA object, apply the summary() to the ANOVA object from Step 1.
# Step 2: Look at the summary of the anova object
summary(cleaner.aov)
##              Df Sum Sq Mean Sq F value Pr(>F)
## cleaner       2   6057    3028    5.29 0.0053 **
## Residuals   597 341511     572
## ---
## Signif. codes:  0 '***' 0.001 '**' 0.01 '*' 0.05 '.' 0.1 ' ' 1
The main result from our table is that we have a significant effect of cleaner on cleaning time (F(2, 597) = 5.29, p = 0.005. However, the ANOVA table does not tell us which levels of the independent variable differ. In other words, we don’t know which cleaner is better than which. To answer this, we need to conduct a post-hoc test.
If you’ve found a significant effect of a factor, you can then do post-hoc tests to test the difference between each all pairs of levels of the independent variable. There are many types of pairwise comparisons that make different assumptions. To learn more about the logic behind different post-hoc tests, check out the Wikipedia page here: https://en.wikipedia.org/wiki/Post_hoc_analysis. One of the most common post-hoc tests for standard ANOVAs is the Tukey Honestly Significant Difference (HSD) test. To see additional information about the Tukey HSD test, check out the Wikipedia page here: https://en.wikipedia.org/wiki/Tukey’s_range_test To do an HSD test, apply the TukeyHSD() function to your ANOVA object as follows:
# Step 3: Conduct post-hoc tests
TukeyHSD(cleaner.aov)
##   Tukey multiple comparisons of means
##     95% family-wise confidence level
##
## Fit: aov(formula = time ~ cleaner, data = poopdeck)
##
## $cleaner
##      diff lwr  upr p adj
## b-a -0.42  -6  5.2  0.98
## c-a -6.94 -13 -1.3  0.01
## c-b -6.52 -12 -0.9  0.02
This table shows us pair-wise differences between each group pair. The diff column shows us the mean differences between groups (which thankfully are identical to what we found in the summary of the regression object before), a confidence interval for the difference, and a p-value testing the null hypothesis that the group differences are not different.
I almost always find it helpful to combine an ANOVA summary table with a regression summary table. Because ANOVA is just a special case of regression (where all the independent variables are factors), you’ll get the same results with a regression object as you will with an ANOVA object. However, the format of the results are different and frequently easier to interpret.
To create a regression object, use the lm() function. Your inputs to this function will be identical to your inputs to the aov() function
# Step 4: Create a regression object
cleaner.lm <- lm(formula = time ~ cleaner,
                 data = poopdeck)

# Show summary
summary(cleaner.lm)
##
## Call:
## lm(formula = time ~ cleaner, data = poopdeck)
##
## Residuals:
##    Min     1Q Median     3Q    Max
## -63.02 -16.60  -1.05  16.92  71.92
##
## Coefficients:
##             Estimate Std. Error t value Pr(>|t|)
## (Intercept)    66.02       1.69   39.04   <2e-16 ***
## cleanerb       -0.42       2.39   -0.18   0.8607
## cleanerc       -6.94       2.39   -2.90   0.0038 **
## ---
## Signif. codes:  0 '***' 0.001 '**' 0.01 '*' 0.05 '.' 0.1 ' ' 1
##
## Residual standard error: 24 on 597 degrees of freedom
## Multiple R-squared:  0.0174, Adjusted R-squared:  0.0141
## F-statistic: 5.29 on 2 and 597 DF,  p-value: 0.00526
As you can see, the regression table does not give us tests for each variable like the ANOVA table does. Instead, it tells us how different each level of an independent variable is from a default value. You can tell which value of an independent variable is the default variable just by seeing which value is missing from the table. In this case, I don’t see a coefficient for cleaner a, so that must be the default value.
The intercept in the table tells us the mean of the default value. In this case, the mean time of cleaner a was 66.02. The coefficients for the other levels tell us that cleaner b is, on average 0.42 minutes faster than cleaner a, and cleaner c is on average 6.94 minutes faster than cleaner a. Not surprisingly, these are the same differences we saw in the Tukey HSD test!